
A trading equity curve simulator runs your strategy stats through thousands of randomized trade sequences — so you see possible account paths, drawdowns, and losing streaks before live capital is at risk. It is preparation, not prediction.
Try it: the free equity curve simulator runs 1,000 paths from your win rate, reward:risk and risk per trade, right in your browser. This guide explains how to choose honest inputs and how to read the results.
How this guide differs: This focuses on Monte Carlo equity curves from your performance metrics (psychology and risk planning). For replaying price history on charts, see how to backtest trading strategies and what is backtesting. For defining drawdown math, see what is maximum drawdown. Feed simulators from a trading journal with honest win rate and R:R.
What is a trading equity curve simulator?
Winning streaks feel invincible; losing streaks make you doubt the plan. An equity curve simulator replaces guesswork with a range of outcomes based on inputs like:
- Win rate
- Average risk-reward (R:R)
- Risk per trade (e.g. 1% of account)
- Number of trades to simulate
Example: 55% win rate, 2:1 R:R, 1% risk per trade — run 1,000 sequences of 100 trades each from a $10,000 account. You will not get one “guaranteed” line. The median path ends near $18,906, 90% of paths finish between $14,889 and $24,006, the typical maximum drawdown is about 5%, one path in ten goes past 7.8%, and one in twenty has a run of 8 straight losses (run it yourself).
Benefits:
- Manage expectations — profitable systems still have deep drawdowns
- Build mental toughness — seeing a 10-loss streak survive in simulation reduces panic live
- Trade with discipline — stick to the plan when you know the statistical envelope
Simulation is not fortune-telling. It turns emotional reactions into probability-aware decisions.
Building a trading equity curve simulator: step-by-step
Whether you use a spreadsheet, Python, or a web tool, every equity curve simulator follows the same workflow. The goal is not one pretty chart — it is a distribution of account paths when trade order changes but your edge statistics stay the same.
Step 1 — Export honest stats from your journal. Pull win rate, average winner, average loser, and risk per trade from at least 100 closed trades. Use how to calculate win rate and your trading journal — not a cherry-picked month.
Step 2 — Set simulation length. Run 500–1,000 trades per path. Shorter runs exaggerate lucky streaks; longer runs show whether your edge survives boredom and drawdown.
Step 3 — Randomize sequence, keep statistics fixed. Each run shuffles wins and losses while holding win rate and R:R constant. That is Monte Carlo in plain English: same casino odds, different nights at the table.
Step 4 — Record tails, not averages. Note the 90th percentile max drawdown, longest losing streak, and how often the account dips below your psychological quit point. Pair this with our drawdown recovery calculator to see how much gain it takes to climb out of those valleys.
Step 5 — Stress one variable at a time. Re-run with 1% risk instead of 2%, or 60% win rate instead of 55%. A good trading equity curve simulator answers sizing questions before you change live behavior.
What an equity curve simulator shows that one backtest cannot
A chart backtest replays historical prices with fixed rules. An equity curve simulator replays your performance statistics in random order. Both are useful; they answer different questions.
| Question | Use this |
|---|---|
| Did my rules work on 2020–2024 data? | Backtesting |
| Can I survive a 12-loss streak at 1% risk? | Equity curve / Monte Carlo simulator |
| How much capital do I need for a 25% drawdown? | Simulator + maximum drawdown math |
If your simulated paths mostly rise but one in ten hits a 30% drawdown, that is not failure — it is information. Size and psychology should match the tail, not the median curve.
Core inputs (garbage in, garbage out)
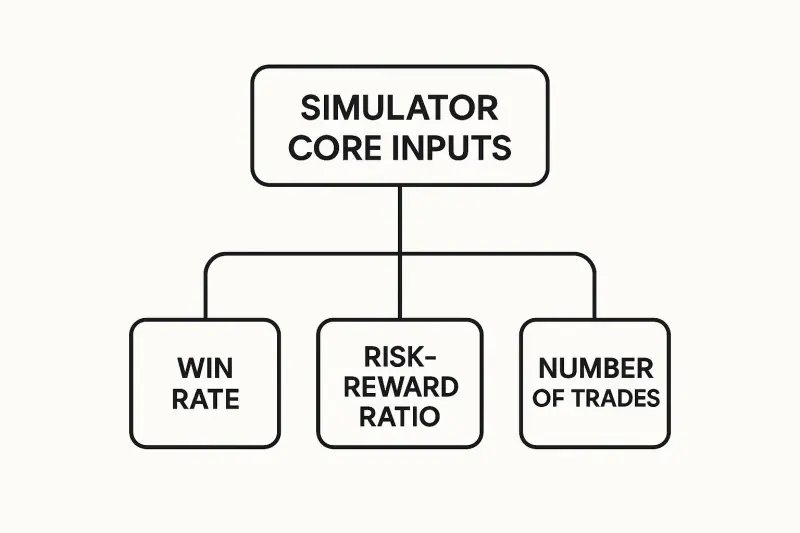
The engine runs on metrics from your journal — not hopes.
| Parameter | What it means | Why it matters |
|---|---|---|
| Win rate | % of winning trades | Drives frequency of streaks and recovery |
| Risk-reward ratio | Avg win size vs avg loss | Defines whether winners cover losers over time |
| Number of trades | Simulation length | Larger samples (500–1,000) smooth random noise |
Rules for honest inputs:
- Win rate — 60 wins in 100 trades = 60%; include every trade, including scratches
- R:R — 2:1 means average winner is 2× average loser (use journal averages, not best trade)
- Sample size — prefer 100+ real trades before trusting outputs; simulate 500–1,000 trade paths for stability
Collect metrics via how to backtest trading strategies or export from TradeReview/your journal.
How to read simulation results
Do not fixate on the highest ending balance. Study patterns that repeat across runs.
Metrics that matter
- Maximum drawdown — largest peak-to-trough drop; if simulations show 25% DD, plan capital and psychology for it (what is maximum drawdown)
- Consecutive losses — how many losses in a row are likely before you abandon a valid edge
Monte Carlo in plain terms
Each run shuffles trade order while keeping the same win rate and R:R. Run again — curves differ. That is the point.
The gap between typical and tail is the number to plan for. In the example above, the typical max drawdown is about 5% and the worst 1 in 10 is about 7.8%. A thinner edge widens it: at a 45% win rate, 1.5R winners, 1% risk and 200 trades, the typical max drawdown is about 12% and one path in ten goes past 19% — with about 1 path in 10 ending below the starting balance.
Goal: stop chasing certainty; manage probabilities.
Putting the simulator to work
Test risk per trade
Many traders start at 2% risk per trade. Simulate 1% and the drawdowns roughly halve — and so does the growth. At 55% / 2R over 100 trades, the median ending balance falls from $34,834 to $18,906, while the worst-1-in-10 drawdown drops from about 15% to about 7.8%. Risk per trade is a dial between growth and pain; the simulator shows both ends before you turn it live.
Stress-test edge improvements
Journal shows 55% win rate — simulate 60% with the same R:R. See impact on growth, drawdown, and streak length before changing live rules.
Questions to answer in simulation:
- Does the edge hold over 1,000 trades?
- What happens if R:R improves from 1.5:1 to 2:1?
- Can the system survive 10 consecutive losses at your chosen risk %?
Build discipline through simulation

The hardest opponent is usually you — not the market. Simulation is a mental gym: rehearse a five-trade live slump after seeing a 15-trade drawdown recover in Monte Carlo.
That exposure builds trust in positive expectancy — you think like a casino owner: short-term losses, long-term edge.
Pair simulation with consistent journaling (TradeReview, spreadsheet, or trading journal Excel template if you prefer sheets).
FAQ
How accurate is an equity curve simulator?
Only as good as your inputs. It mirrors historical performance statistics — not black swans or future discipline slips. Use 100+ real trades minimum for inputs.
How many trades should I simulate?
For the simulation run, use 500–1,000 trades. For the inputs, derive win rate and R:R from as much real data as you have.
Can it prove my strategy is profitable?
No proof — strong validation. If most paths rise with tolerable drawdowns, confidence goes up. If most paths blow up, refine before live size.
What is the best free equity curve simulator workflow?
Export win rate and average R from your journal, enter them in the free equity curve simulator with your real risk per trade, and read the worst-1-in-10 max drawdown — not the median ending balance. Feed inputs from the win rate and expectancy calculator if you are still building sample size.
Equity curve simulator vs backtesting?
| Equity curve / Monte Carlo | Chart backtesting | |
|---|---|---|
| Input | Win rate, R:R, risk % | Historical prices, rules |
| Output | Distribution of account curves | Trade list on past data |
| Best for | Risk psychology, position sizing | Rule validation on history |
Related reading
- Why every trader needs a trading journal — source data for simulations
- What is maximum drawdown — interpret simulator valleys
- How to backtest trading strategies — collect win rate and R:R
- Daily P&L tracking — session totals that feed simulator inputs
- Equity curve simulator — 1,000 Monte Carlo paths from your stats
- Free trading calculators — drawdown recovery and win rate tools
- Risk management for traders — size positions to simulated tails