

A profit and loss template in Google Sheets is a spreadsheet that totals your income and expenses by category and calculates net profit automatically. The setup in this guide uses three tabs: Transactions (every income and expense entry), Categories (the list each entry is tagged with) and Summary (the P&L statement), with SUMIFS formulas linking them. Building it yourself means the categories match how you actually earn and spend — client projects for a freelancer, setups and fees for a trader — instead of a generic download.
This guide covers the structure, the formulas, charts, data validation and conditional formatting, multiple currencies, and common SUMIFS errors.
Why Custom Templates Beat Generic Downloads
Most P&L templates you find online don’t fit how you work. They try to shove freelancers, traders, and small business owners into rigid boxes that have nothing to do with how they actually operate. Trying to make a pre-made sheet work is often more frustrating than it’s worth, and that frustration can quickly lead to giving up on tracking altogether.
The good news? Building your own system in Google Sheets puts you in complete control. It’s about creating a tool that works for you, not against you. This isn’t just about making another spreadsheet; it’s about building financial clarity and the discipline you need from the ground up for long-term success.
Take Control of Your Financial Story
When you build your own template, you get to track the metrics that actually matter for your growth. A day trader, for example, can track profit per setup. A freelance designer can see their income per client project. These are the kinds of specific, actionable details that get completely lost in generic templates.
This shift from just plugging in numbers to actively managing your finances is where real progress happens. When you build the system yourself, you understand every single calculation and can trust the insights it gives you. That’s what builds the discipline needed for long-term success.
Google Sheets also gives you that flexibility without the price of specialized accounting software. A well-structured P&L statement gives you an at-a-glance view of profitability: it separates direct costs from operating expenses so you can calculate both gross and net profit.
Building Your P&L Foundation
A powerful profit and loss template in Google Sheets doesn’t start with complicated formulas. It starts with a rock-solid, scalable structure. Getting this foundation right is what separates a confusing spreadsheet from a clear financial dashboard you can actually rely on for the long haul.
The trick is to organize your data logically across three essential tabs. Think of it as a simple, effective workflow:
- Transactions Tab: This is your source of truth. Every single income and expense entry, no matter how small, gets recorded here. Discipline is everything on this sheet.
- Summary Tab: This is your high-level P&L statement. It will pull all the raw data from your Transactions tab to show you the big picture — total revenue, total expenses, and your net profit or loss.
- Categories Tab: This little tab is the secret to keeping your data clean and consistent. It’s just a simple list of all your income and expense categories, which you’ll use to tag each transaction.
Moving from a generic, off-the-shelf solution to a custom-built template is where you really start to gain financial clarity.
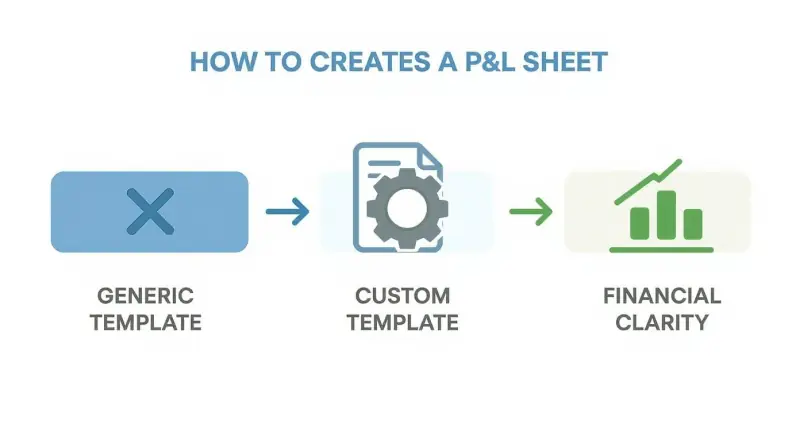
As you can see, customizing your template is what turns a basic sheet into a powerful tool for clear financial insight.
Defining Your Categories
Before you can log a single transaction, you need to define your categories. This is where you have to think about what metrics truly matter to your specific situation. Don’t be generic here — specific categories give you much deeper insights.
For instance, a freelance designer’s categories might look something like this:
- Income: ‘Client Project A Revenue’, ‘Client Project B Revenue’, ‘Consulting Fees’
- Expenses: ‘Software Subscriptions’, ‘Marketing Spend’, ‘Office Supplies’, ‘Contractor Payments’
This level of detail lets the designer instantly see which client is most profitable or if their software costs are creeping up.
Now, flip that around for a day trader. Their categories would be completely different, tailored to their unique activities:
- Income: ‘Long Trade Profits’, ‘Short Trade Profits’, ‘Options Premium’
- Expenses: ‘Platform Fees’, ‘Data Subscriptions’, ‘Trading Software’, ‘Commission Costs’
This kind of specific breakdown helps the trader analyze which strategies are actually working and pinpoint where fees are eating into their bottom line. For traders looking to take this a step further, integrating a P&L with a dedicated journal is a game-changer. You can see how these concepts expand by checking out this detailed trading journal template in Excel.
The whole point is long-term clarity. By creating categories that reflect how you actually earn and spend money, you’re building a system that will give you valuable, actionable insights for months and even years down the road.
Setting Up Your Transactions Tab
The Transactions tab is the log of every income and expense entry, one row per transaction, and it feeds every total on the Summary tab. This is where you’ll spend most of your time doing data entry, and consistency is non-negotiable. Every single transaction has to be recorded to ensure your ‘Summary’ tab is accurate.
This sheet is where you’ll log every single income and expense item. To get started, you’ll need a few essential columns to capture the raw data that will fuel your entire P&L statement.
Essential Columns for Your Transactions Tab
| Column Name | Purpose & Example | Data Type |
|---|---|---|
| Date | The exact date the transaction occurred. Ex: 01/15/2024 | Date |
| Description | A brief note explaining the transaction. Ex: “Adobe Creative Cloud Subscription” or “Profit from TSLA trade” | Text |
| Category | A dropdown menu linked to your ‘Categories’ tab. Ex: “Software Subscriptions” or “Long Trade Profits” | Dropdown |
| Amount | The monetary value. Use positive numbers for income, negative for expenses. Ex: 59.99 or -24.95 | Number (Currency) |
By diligently logging every detail here, you’re creating a reliable financial history. This disciplined practice is the absolute bedrock of understanding your true profitability.
Automating Your P&L with Key Formulas
Now that you have a solid structure, it’s time to make your profit and loss template in Google Sheets actually work for you. This is the fun part, where we connect your ‘Transactions’ log to your ‘Summary’ sheet and turn that static data into a living, breathing financial tool. Don’t worry, this doesn’t involve complex coding — just a couple of powerful formulas.
The absolute workhorse for any automated P&L sheet is the SUMIFS function. It sounds more intimidating than it is.
Essentially, SUMIFS allows you to tell Google Sheets: “Go look at my ‘Transactions’ tab, find every single line item with this specific category label, and add up all the amounts next to them.”
The Power of SUMIFS
Instead of painstakingly adding up dozens (or hundreds) of individual transactions, SUMIFS does all the heavy lifting in an instant. It filters and calculates on the fly, making sure your P&L statement is always accurate and up-to-date.
Let’s jump back to our freelance designer example. On their ‘Summary’ sheet, next to the “Client Project A Revenue” line item, they’d pop in a formula like this:
=SUMIFS(Transactions!D:D, Transactions!C:C, "Client Project A Revenue")
Let’s quickly break that down:
- Transactions!D:D: This is the column with the numbers to add up — in our case, the ‘Amount’ column on the ‘Transactions’ sheet.
- Transactions!C:C: This is where Google Sheets should look for our criteria — the ‘Category’ column.
- “Client Project A Revenue”: This is the exact text it’s searching for in the category column.
That one formula instructs Google Sheets to find every transaction you’ve categorized as “Client Project A Revenue” and sum the amounts. The result is a perfect total that updates automatically the second you add a new transaction.
The real magic here is consistency. By using formulas tied to your predefined categories, you completely remove the risk of human error from manual math. This disciplined approach builds a reliable financial picture, giving you the confidence to make decisions based on real data, not guesswork.
Calculating Your Key Profit Metrics
Once you’ve plugged in SUMIFS for all your income and expense categories, figuring out your profit is just simple arithmetic. This is the part that truly tells the story of your financial performance. You’ll need three main figures:
- Total Revenue: The sum of all your income categories. If your individual income totals are in cells B2 through B5 on your ‘Summary’ sheet, the formula is just =SUM(B2:B5).
- Total Expenses: Same idea, but for all your expense categories. If those totals live in cells B7 through B15, the formula is =SUM(B7:B15).
- Net Profit (or Loss): This is the bottom line. Because expenses were entered as negative numbers, your Total Expenses cell is already negative, so you add the two: =B6+B16, where B6 holds Total Revenue and B16 holds Total Expenses. (If you entered expenses as positive numbers instead, use =B6-B16.)
For traders, precisely calculating trading profit is the entire ballgame. The formulas are identical, but the categories are different — you’re summing up ‘Long Trade Profits’ and subtracting things like ‘Commission Costs’ and ‘Platform Fees’ to find the true net gain.
This automated net profit calculation is the ultimate measure of your financial health. It shows you, in no uncertain terms, whether your efforts are paying off. Seeing this number update in real-time gives you instant feedback, which is incredibly motivating during good months and a clear signal to analyze what went wrong during the tough ones.
Visualizing Your Financial Story with Charts
Numbers sitting in rows are just data. But numbers brought to life in a chart? That’s a story.
This is where your profit and loss template in Google Sheets goes from being a simple accounting tool to an intuitive dashboard you can understand in a split second. Seeing your financial performance visually is just so much more powerful than staring at a static number on a spreadsheet.
We’re not talking about complicated data science here. It only takes a couple of clicks to create visuals that reveal trends, flag potential problems, and help you celebrate the wins. This is how you shift from just doing reactive bookkeeping to making proactive, strategic decisions.
See Where Your Money Is Going
First up, let’s get a handle on expenses. It’s way too easy to lose track of where your hard-earned money is actually going, especially when all those small costs start to add up. A simple pie chart gives you instant clarity.
Imagine you’re a trader and you’ve got a nagging feeling that your platform fees are eating into your profits. A pie chart can confirm that suspicion in seconds. Just select your expense categories and their totals, and you might see that Platform Fees make up a whopping 40% of your total expenses. That’s a powerful insight that would immediately get you researching more cost-effective brokers.
Creating one couldn’t be easier:
- On your ‘Summary’ sheet, highlight your expense categories and their total amounts.
- Head up to Insert > Chart.
- Google Sheets is pretty smart and will probably suggest a Pie Chart right away, but you can always select it from the Chart Editor if it doesn’t.
That simple visual tells you exactly where to focus your cost-cutting efforts.
We often get so caught up in chasing profits that we forget how much disciplined expense management contributes to the bottom line. A clear visual forces you to confront spending habits you might otherwise ignore, which is a crucial step toward long-term financial health.
Track Your Progress Over Time
While a pie chart gives you a snapshot, a bar chart shows you the movie. Tracking your net profit month-over-month is one of the most important habits you can build. It answers the most critical question of all: “Am I actually growing?”
A monthly bar chart instantly reveals your financial trajectory. Are your profits climbing steadily? Are there predictable seasonal dips you need to plan for? Or was last month’s loss a one-off fluke or the start of a worrying trend?
Seeing your net profit rise and fall visually helps you connect your actions to their financial outcomes. This feedback loop is essential for refining your strategy, staying motivated, and catching small problems before they become big ones.
Taking Your P&L to the Next Level
Three features make a Google Sheets P&L more accurate and faster to read: data validation keeps categories consistent, conditional formatting color-codes results, and custom calculations add trading metrics. Each one cuts down on manual errors and gets you to the insight sooner.
Keep Your Data Clean with Data Validation
One of the biggest culprits of a messy P&L is inconsistency. A simple typo — like “Software” versus “Software “ (with an accidental space) — can completely wreck your formulas and throw off your entire summary.
Data Validation is the perfect fix. This feature lets you create a dropdown menu in your ‘Category’ column that pulls choices directly from your ‘Categories’ tab. By forcing a selection from a predefined list, it completely stamps out typos and makes sure every single transaction is categorized correctly. It’s a tiny bit of setup that saves you from hours of frustrating troubleshooting later.
Get Instant Feedback with Conditional Formatting
Our brains are wired to process visual cues much faster than raw numbers. You can use this to your advantage with Conditional Formatting, which automatically color-codes cells based on what’s inside them. It’s a surprisingly effective way to get an instant read on your performance.
You can set up a simple rule on your ‘Summary’ tab:
- If your Net Profit is greater than 0, color the cell green.
- If your Net Profit is less than 0, color the cell red.
This immediate visual feedback is more powerful than it sounds. That flash of green gives you a small hit of accomplishment, while a flash of red is a clear, emotion-free signal that it’s time to review what went wrong.
It’s easy to become numb to just numbers on a screen. Adding color brings in a psychological element that helps you internalize your results — celebrating the wins and prompting a quick, judgment-free analysis of the losses.
Add Custom Calculations for Deeper Insights
For any trader, a standard P&L is just the starting point. The real value comes from tracking performance metrics that show you how effective your strategy actually is. Your Google Sheet can easily handle these custom calculations.
Just add a few new columns or a separate section to calculate key trading metrics like:
- Win/Loss Ratio: The total number of winning trades divided by the total losers.
- Average Profit Per Trade: Your total net profit divided by the total number of trades.
- Return on Investment (ROI): A crucial metric that shows how efficiently you’re using your capital.
Adding these custom fields turns your P&L from a simple expense tracker into a serious analytical tool. Getting a handle on these numbers is critical, and you can learn more about the details in our guide on calculating trading profit. It’s this deeper analysis that truly helps you refine your approach and make data-driven decisions for long-term growth.
Got Questions? Let’s Get Them Answered
These are the most common questions traders and freelancers ask when building a profit and loss template in Google Sheets: multiple currencies, bank connections, and SUMIFS errors.
How Do I Handle Multiple Currencies?
Handle multiple currencies by converting every transaction into a single base currency. This matters most for traders on global markets and freelancers with international clients. It’s the only way to get a truly accurate picture of your performance.
The trick is to add two new columns to your ‘Transactions’ tab: ‘Original Amount’ and ‘Original Currency’. From there, you can create a final column — let’s call it ‘Converted Amount (USD)’ — and let the GOOGLEFINANCE function do the heavy lifting.
If your original amount is in cell C2 and the currency code (like “EUR”) is in D2, the formula looks like this:
=C2 * GOOGLEFINANCE("CURRENCY:" & D2 & "USD")
This will automatically pull the exchange rate and convert the transaction into US dollars on the fly. Now all your summaries and calculations will be perfectly consistent.
Can I Connect This to My Bank Account?
Google Sheets cannot link directly to a bank account, but third-party add-ons can sync bank transactions into your P&L sheet. It saves a ton of time on manual data entry.
Tools like Tiller Money or Sheetgo are popular options you can find on the Google Workspace Marketplace. They securely sync your transaction data into a specific tab in your sheet. Just keep in mind that most of these powerful time-savers come with a paid subscription.
Why Is My SUMIFS Formula Showing an Error?
A SUMIFS formula usually shows an error such as #N/A or #VALUE! for one of three reasons: mismatched ranges, a typo in the category name, or incorrect syntax.
- Mismatched Ranges: This is the #1 culprit. Your criteria range and the range you want to sum must be the exact same size. For instance, you can’t check for criteria in C2:C90 but then try to sum amounts from D2:D100.
- A Sneaky Typo: A tiny difference between the category name in your formula and the one in your ‘Transactions’ tab will break everything. Look for extra spaces, like “Marketing “ when it should just be “Marketing”.
- Incorrect Syntax: A single missing comma or a misplaced parenthesis is all it takes to throw an error. Give your formula a quick once-over to make sure the structure is sound.
Related reading
- Trading journal template Google Sheets — trade log beyond generic P&L
- Excel trading journal — spreadsheet metrics for traders
- Calculating trading profit — net P&L after fees
- What does P&L stand for — terminology for your template
- Best free trading journal — free plans, caps and what to tag
Start journaling with TradeReview for free — trading P&L without rebuilding spreadsheets.