

Day trading chart patterns are recurring price shapes on intraday charts — flags, triangles, double tops, head and shoulders — that traders use to time entries and place stops. They describe what buyers and sellers have done so far. They do not predict anything on their own, and no pattern works every time.
What a pattern gives you is a defined trade: a trigger, a stop where the idea is wrong, and a rough target. That makes patterns easy to journal, and journaling them is how you find out which ones work for you on your markets and your timeframe.
This guide covers the main continuation and reversal patterns, the candlestick signals traders use to confirm them, and how to tag pattern trades so each one gets its own statistics.

Continuation vs reversal patterns
- Continuation patterns form during a pause in a trend and suggest the trend resumes: flags, pennants, triangles, the opening range breakout.
- Reversal patterns form at the end of a move and suggest a change of direction: double tops and bottoms, head and shoulders and its inverse, wedges.
Continuation patterns trade with the trend, so they usually have more favorable odds intraday. Reversals offer better prices but fail more often, because you are betting against the move in progress.
Continuation patterns
Bull and bear flags
A sharp move (the pole) followed by a short, shallow channel against it (the flag).
- Trigger: break of the flag’s upper line (bull flag) or lower line (bear flag).
- Stop: the other side of the flag.
- Target: often the length of the pole, measured from the breakout.
- Fails when: the “flag” retraces most of the pole — that is no longer a pause.
Pennants
Like a flag, but the pause narrows into a small symmetrical triangle. Same trigger, stop and target logic. Pennants are short-lived on intraday charts; if it takes too long to resolve, the momentum is gone.
Triangles (ascending, descending, symmetrical)
- Ascending: flat resistance, rising lows. Buyers keep stepping in higher.
- Descending: flat support, falling highs.
- Symmetrical: both sides converge; direction comes from the break.
Trigger is a close beyond the flat side (or either side for symmetrical), stop inside the pattern, target the height of the triangle’s widest part.
Opening range breakout
Not a classic shape, but one of the most traded intraday setups. Mark the high and low of the first 5, 15 or 30 minutes; trade a break of either side with a stop at the midpoint or the other side. It is popular because the levels are objective — which also makes it easy to measure.
Reversal patterns
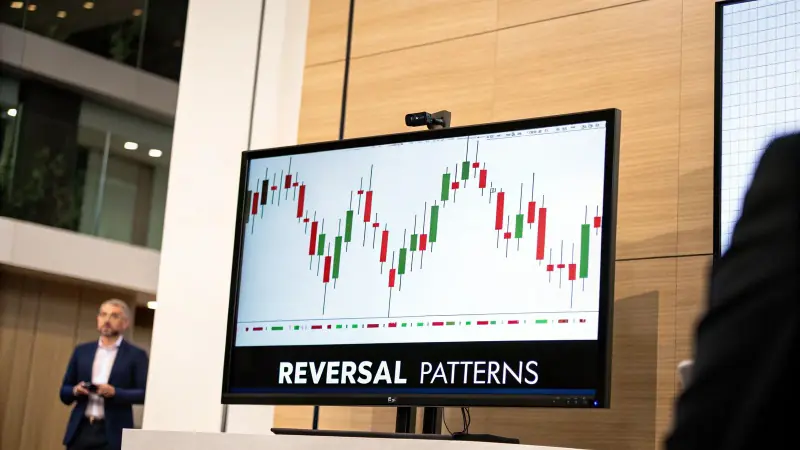
Double tops and double bottoms
Two tests of the same level that fail to break it. The trigger is a break of the “neckline” — the low between two tops, or the high between two bottoms. Stop above the tops (or below the bottoms); target the height of the pattern.
Head and shoulders and inverse head and shoulders
Three peaks with the middle one highest (head and shoulders), or three troughs with the middle one lowest (inverse). The trigger is a break of the neckline drawn through the two lows (or highs) between them. Investopedia’s head and shoulders entry has diagrams.
Intraday, these patterns are often messy. Trade the neckline break, not the shape you think is forming.
Rising and falling wedges
Two converging lines sloping the same way. A rising wedge in an uptrend shows weakening momentum and often breaks down; a falling wedge often breaks up.
Candlestick signals: confirmation, not setups
Single candles and pairs — hammers, inverted hammers, dojis, engulfing bars, gravestone dojis — show who won a single bar. On their own they are weak signals. They are more useful at a level a pattern already defines:
- A hammer or bullish engulfing bar at a double-bottom low or flag support.
- A gravestone doji or inverted hammer at resistance, where buyers pushed up and failed.
- A doji after a long move, as a sign the move is pausing.
Log the candle as a confirmation field (confirm: hammer), not as its own setup. After enough trades you will see whether waiting for it improves your results or just makes you late.
Volume and time of day
Volume separates real breaks from fake ones. A breakout on rising volume has more participation behind it; a break on falling volume is more likely to reverse. Compare the breakout bar’s volume with the recent average.
Time of day matters as much as the pattern. For US stocks, the first 60–90 minutes after the open usually bring the cleanest moves; the midday session is choppier, and many breakouts there fail. Futures and forex have their own active windows — see best times to trade futures.
How to tag and review chart pattern trades
A pattern you cannot filter is a story. Tag each trade so every pattern gets its own sample:
- One tag per pattern, written the same way every time —
BULL-FLAG,ORB-15,DBL-BOTTOM,HS-INV. - Context fields: with or against the higher-timeframe trend, time of day, volume confirmation (yes/no), candlestick confirmation.
- Entry type: breakout, retest of the broken level, or anticipation inside the pattern.
- Stop and target in R, so a 0.5R scratch and a 2R winner are comparable.
- A screenshot, marked with the pattern, entry and stop. Reviewing 30 screenshots of the same pattern side by side shows more than any statistic.
Then review per tag after ~30 trades: win rate, average win and loss in R, expectancy, and how results change with volume confirmation or time of day. Most traders find one or two patterns carry their results and one or two cost them money. Drop the losers before adding new patterns. The method is in best trading strategies; the math in how to calculate win rate.
Frequently Asked Questions
Which day trading chart pattern is the most reliable?
None is reliable in general. Results depend on the market, timeframe, time of day and how you trade the pattern. The most reliable pattern for you is the one with the best expectancy in your own records after a real sample.
How do I avoid false breakouts?
Wait for a candle close beyond the level, check that volume is above average on the break, and avoid low-volume periods such as midday. Some traders enter on the retest of the broken level instead of the first break.
What timeframe is best for day trading chart patterns?
Most day traders use 1-minute and 5-minute charts for entries, with a 15-minute or hourly chart for context. Use the same timeframe consistently so your results are comparable.
Are candlestick patterns enough to trade on?
Usually not. A single candle is a weak signal by itself. They work better as confirmation at a level that a chart pattern or support and resistance already defines.
How many chart patterns should I trade?
Two or three, until each has a sample of about 30 trades. Trading every pattern at once leaves you with small samples and no conclusions.
Bottom line
Day trading chart patterns — flags, pennants, triangles, opening range breakouts, double tops and bottoms, head and shoulders, wedges — give you a defined trigger, stop and target. Candlestick signals and volume help confirm them; time of day often matters as much as the shape. Tag each pattern separately, add context fields and a screenshot, and keep the patterns that still pay after a real sample.
When you want win rate and expectancy per pattern without a spreadsheet, open the journal and tag your next trades.
Chart patterns describe past price behavior and do not guarantee future results. This article is for education, not investment advice.