
Let’s be honest: the raw statistics on day trading success can be a tough pill to swallow. It’s easy to get caught up in the dream of quick profits, but the data paints a much more challenging picture. Studies and broker data suggest that a very small percentage, often cited as being as low as 1% of day traders, remain profitable over a five-year period. It’s a journey where many traders drop out within the first few months, often due to a few predictable, but avoidable, mistakes.
This guide isn’t here to scare you, but to give you a realistic, data-backed view of the landscape. Understanding the odds is the first step toward building an approach that can actually last.
Confronting the Reality of Day Trading Success
Before diving into strategies, we need to have a frank discussion about the numbers. Social media often showcases a fantasy lifestyle funded by trading, but that’s a world away from the statistical reality for most. The path to becoming a consistently profitable trader is a marathon, not a sprint. It’s a journey filled with steep learning curves, emotional challenges, and financial hurdles. Acknowledging this struggle is crucial.
Many aspiring traders enter the markets unprepared for the mental and financial grind. This lack of preparation — not a lack of intelligence or desire — is precisely why the failure rate is so high.
The Sobering Numbers
The day trading success statistics are a crucial reality check. A tiny fraction of traders ever achieve consistent profitability. Data suggests that while some might find initial success, only around 13% manage to maintain gains over six months, and even fewer succeed long-term.
These aren’t just random numbers. Aggregated data from global markets shows that a staggering 40% of traders quit within the first month. After three years, only 13% are still active. You can discover more about these day trading figures on Unbiased.com.
The chart below paints a clear picture of just how quickly most traders wash out.
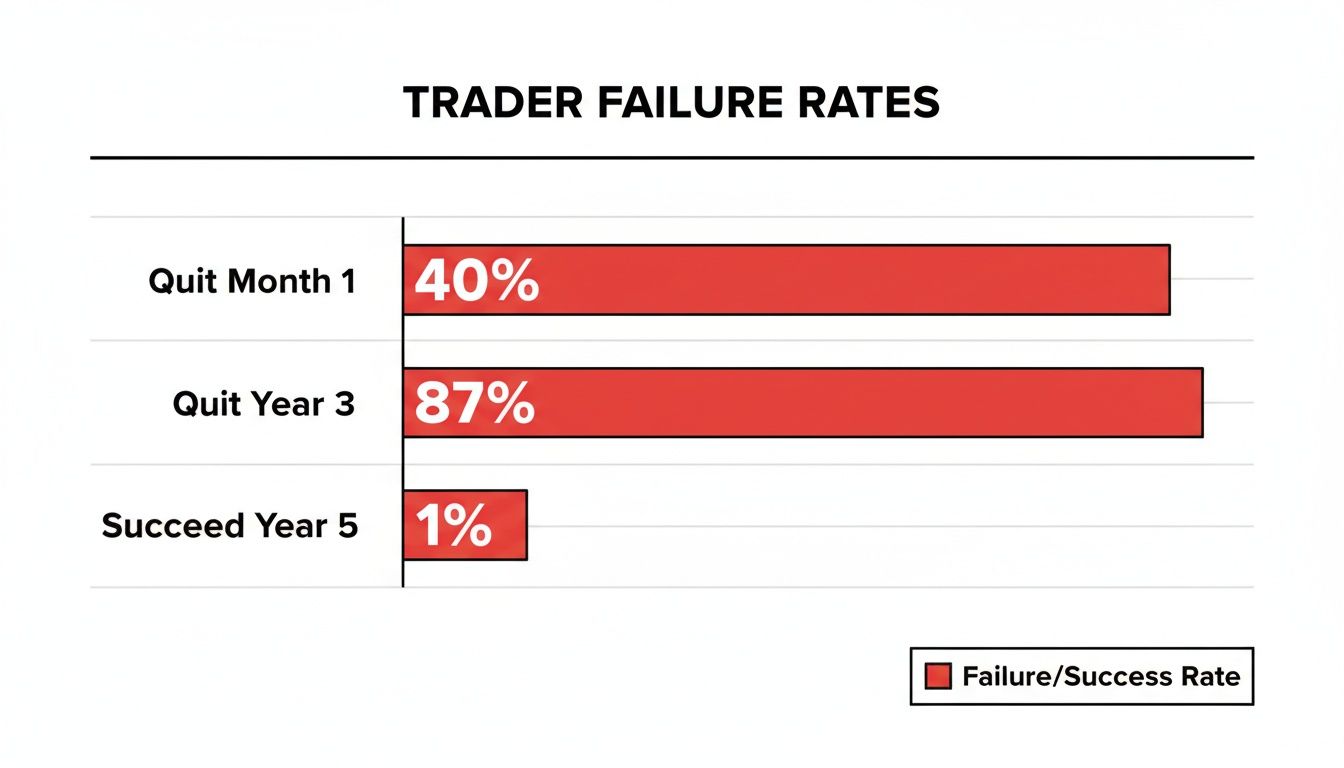
This visual really drives home how difficult it is to stick around, let alone succeed, in the long run.
To give you a clearer view, here’s a table summarizing the attrition and profitability rates over different timeframes.
Day Trader Profitability Rates Over Time
A summary of key statistics showing the percentage of profitable day traders across different durations, illustrating the difficulty of long-term success.
| Timeframe | Percentage of Profitable Traders | Source Highlight |
|---|---|---|
| First Month | 40% Quit Trading Entirely | High initial burnout and capital loss |
| 6 Months | 13% Maintain Profitability | The initial “luck” phase wears off for most |
| 3 Years | 87% Quit Trading Entirely | Long-term consistency proves elusive |
| 5 Years | ~1% Remain Consistently Profitable | The elite few who master the craft |
These figures highlight the brutal learning curve. Short-term wins are possible, but translating them into a sustainable career is the real challenge.
Why Do So Many Traders Fail?
The sky-high failure rate isn’t just about bad luck. It’s rooted in a few key challenges that trip up the average retail trader. These hurdles aren’t impossible to clear, but they require discipline, a solid strategy, and a professional mindset.
Here are some of the most common reasons traders blow up their accounts:
- Emotional Decision-Making: Trading on fear, greed, or a “gut feeling” instead of a tested plan is a recipe for disaster.
- Lack of a Statistical Edge: Too many traders are just clicking buttons without a repeatable strategy that has a positive expectancy — a mathematical edge that plays out over many trades.
- Poor Risk Management: Failing to define risk, using sloppy position sizing, and ignoring stop-losses can wipe out an account in just a handful of bad trades.
The goal isn’t to be scared by the statistics but to be motivated by them. Understanding that most fail should make you ask, “What is the successful minority doing that the others are not?” The answer is almost always rooted in discipline and data-driven analysis.
These stats also draw a clear line between different short-term trading styles. Day trading means closing all positions by the end of the day, but other approaches might offer a different risk-reward profile. We explore this in our guide on swing trading vs. day trading.
Ultimately, acknowledging these numbers is the first step toward joining that small percentage of traders who build lasting success.
Why the House Almost Always Wins in Day Trading
It’s one thing to see the sobering day trading success statistics. It’s another to truly understand why the numbers are so bleak. The key is realizing the market isn’t a coin flip with a 50/50 shot. Think of it more like a casino — the house always has a small, built-in edge that works against you over time.
Every day, traders are battling invisible headwinds that slowly but surely eat away at their capital. These aren’t just bad luck or personal mistakes; they are structural hurdles baked into the very game of trading itself.
The Unseen Costs of Playing the Game
Imagine trying to fill a bucket that has a tiny hole in the bottom. No matter how much water you pour in, you’re always losing a little bit. In day trading, transaction costs are that constant, nagging leak.
Even when your trade ideas are spot-on, these costs are draining your account. They’re more than just commissions and include a few key things:
- Commissions and Fees: Sure, many brokers advertise zero-commission trades, but that rarely covers everything. You might still have fees for data feeds, platform access, and order routing that can quickly pile up.
- The Bid-Ask Spread: This is the small gap between what buyers are willing to pay (the bid) and what sellers are willing to accept (the ask). As a day trader, you almost always buy at the higher price and sell at the lower one. It means every single trade starts with a small, instant loss you have to climb out of just to break even.
- Slippage: This happens when your order gets filled at a different price than you expected. In fast-moving markets, the price can tick against you in the milliseconds it takes for your order to go through.
On their own, these “frictions” seem tiny. But when you’re making dozens of trades a day, they compound into a massive hurdle. This is the house edge, live and in action.
The Academic View of Trader Performance
These disadvantages aren’t just theories; researchers have put hard numbers to them, and the results are pretty stark.
One of the most eye-opening studies analyzed the entire Taiwanese stock market over a 14-year period. A landmark analysis of Taiwan’s Stock Exchange from 1992-2006 found that only 1% of day traders were predictably profitable after accounting for transaction costs.
On any given day, a very high percentage of day traders lost money after fees. Even more telling, a large portion of all day trading volume was generated by traders with a history of losses.
This data hammers home a crucial point: just beating the market isn’t enough. You have to make enough profit to cover the market’s spread, your broker’s fees, and your own execution errors before you see a single dollar for yourself.
The Psychological Headwinds
Beyond the structural costs, the biggest obstacle for most traders is the one staring back at them in the mirror. The human mind simply isn’t wired for the kind of high-stakes, rapid-fire decisions that day trading demands.
Our brains are loaded with cognitive biases — mental shortcuts that can be financially toxic in the markets.
- Fear of Missing Out (FOMO): This is the classic trap of chasing a stock that’s already soaring. It pushes traders to buy at the absolute peak, right before it reverses.
- Revenge Trading: After a tough loss, it’s so tempting to jump right back in and try to “win it back” from the market. This emotional reaction leads to impulsive, oversized trades that almost always dig a deeper hole.
- Confirmation Bias: We all have a tendency to look for information that confirms what we already believe. If a trader is bullish on a stock, they’ll unconsciously filter out all the warning signs and focus only on the good news.
These emotional and psychological factors are the final piece of the puzzle. The market is a cold, unemotional system, but the people playing in it are not. Overcoming these internal challenges requires massive discipline and a systematic approach — viewing them not as personal failings, but as systemic challenges that need to be managed.
The Common Mistakes That Skew the Statistics
Those tough day trading success statistics aren’t just numbers on a page — they’re the direct result of human behavior under pressure. While things like commissions and spreads create a headwind, the vast majority of trading losses boil down to a handful of predictable, psychology-driven mistakes. These are the emotional traps that can turn a perfectly good strategy into a blown-up account.
We’ve talked about the market’s built-in challenges, but now let’s shift to the personal errors that feed those statistics. Spotting these patterns in your own trading is the first — and most important — step toward fixing them.
The Disposition Effect: Letting Losers Run Wild
One of the most well-documented and destructive biases in trading is the disposition effect. In simple terms, it’s our tendency to sell winning trades way too early while holding onto our losers for far too long.
Why on earth do we do this? It’s basic human psychology. Locking in a small win feels great; it’s a quick hit of validation. On the flip side, closing a trade for a loss means admitting you were wrong, and that’s a feeling most of us would rather avoid.
-
Practical Example: Imagine you buy a stock at $50, with a price target of $52 and a stop-loss at $49. The stock quickly pops to $51. Instead of sticking to the plan, you get nervous about the profit vanishing and sell right away. A few hours later, it hits your original $52 target, and you’ve left good money on the table.
-
The Flip Side: Now, let’s say that same stock drops to $49.50 right after you buy it. Your plan was to cut your losses at $49, but you hesitate. “It’ll probably bounce back,” you tell yourself. Then it drops to $48, then $47. By holding on, you’ve turned a small, manageable loss into a devastating one — all to avoid the sting of being wrong.
Revenge Trading and the Downward Spiral
Every single trader has frustrating losses. It’s what you do in the moments afterward that separates the pros from the amateurs. Revenge trading is that impulsive urge to jump right back into the market to “win back” the money you just lost.
Let’s be clear: this isn’t trading. It’s emotional gambling. When you’re in that state, your decisions are clouded by anger and desperation. This almost always leads to bigger position sizes, sloppy entries, and throwing your strategy completely out the window.
A single bad trade is just a data point. A series of emotionally-fueled revenge trades is how accounts are destroyed. The market doesn’t know you lost money, and it certainly doesn’t care.
Think of a trader who takes a $200 loss on a well-planned trade. Furious, they immediately jump into the next stock they see moving, doubling their position size to make back the $200 plus a profit. This unplanned, oversized trade is now driving their actions, and one more loss could wipe out an entire week’s worth of gains.
The Allure of Overtrading
Finally, we have the classic mistake of overtrading — the belief that being busy is the same as being profitable. This is especially tempting for new traders who feel like they have to be in a trade to make money. They start seeing “setups” that aren’t really there, forcing trades out of boredom or a fear of missing out (FOMO).
This habit directly feeds the “house edge” we talked about earlier. Every extra trade you take racks up more in commissions and spread costs, slowly bleeding your account dry even if your win rate is decent. A professional trader understands that sometimes, the best trade is no trade at all. They have the discipline to wait patiently for a high-probability setup that fits their plan perfectly, rather than chasing mediocre opportunities all day long.
How to Shift from Gambling to Data-Driven Trading

Let’s be honest. The ugly truth behind the day trading success statistics isn’t some big secret. It boils down to emotional, gut-wrenching decisions made in the heat of the moment. The jump from the majority who lose money to the minority who succeed is all about one thing: moving from impulsive gambling to objective, data-driven trading.
This isn’t about finding a magic indicator or a secret formula. It’s about building a solid process for understanding your own performance. And the single best tool for that job is a trading journal.
Beyond a Simple Diary
A real trading journal is so much more than a list of wins and losses. Think of it as your personal performance analytics system. When you use it right, it turns your trading from a string of random bets into a business with real, measurable results. It forces you to confront the hard data of what you’re actually doing — not what you think you’re doing.
This process is the perfect antidote to the psychological traps we’ve talked about. That “gut feeling” you had about a stock might have felt like a sure thing. But a detailed journal can show you, in black and white, that your gut-feeling trades have a negative expectancy and have consistently drained your account over the last 50 trades.
Your trading journal is the ultimate accountability partner. It doesn’t care about your feelings or excuses; it only shows you the numbers. This cold, hard data is what forces you to evolve from an emotional gambler into a disciplined, data-driven trader.
By logging every single trade, you start building a personal database of your performance. This is the raw material you need to find your statistical edge, plug the leaks in your strategy, and build a process that can actually hold up under market pressure.
How Data Exposes Costly Habits
A modern trading journal like TradeReview does the heavy lifting for you, crunching the numbers to serve up insights that would take hours to figure out on your own. It puts your trading habits under a microscope, revealing the hidden patterns that are really driving your profit and loss (P&L).
Here’s how this data-first approach helps you fix common mistakes:
- Identifying Your Best Setups: Stop guessing which strategies work. By tagging each trade (e.g., “Opening Range Breakout,” “VWAP Bounce”), your analytics will eventually show you exactly which patterns make you the most money.
- Controlling the Disposition Effect: Are you cutting your winners short and letting losers run? Your journal will make it painfully obvious. A quick look at your average win size versus your average loss will tell you if your risk-to-reward is broken.
- Pinpointing Overtrading: Take a look at your trade calendar. You might discover that your worst days are consistently the ones where you traded the most. This data can prove that sometimes, trading less is the most profitable thing you can do.
This kind of clear, visual feedback makes it impossible to ignore the weak spots in your strategy or discipline, forcing you to make the adjustments that matter.
Building a Long-Term Edge
At the end of the day, a trading journal is your tool for building a lasting edge. Every trade, win or lose, becomes another data point that helps you refine your approach. You stop looking for some guru to give you the answers and start relying on your own verified performance data.
Does this guarantee you’ll make money? Of course not. Nothing can. But it gives you a fighting chance to beat those daunting statistics by treating trading like the serious, performance-based profession it is. It helps you understand not just your trades, but yourself as a trader.
You can even take it a step further and explore tools that model potential outcomes. Check out our guide on how to use an equity curve simulator to project where your performance could go based on the stats you’re already tracking.
Putting Your Trading Performance Under the Microscope
Getting your trade data into one place is a great first step. But the real magic happens when you start digging into that data to find your true edge. A trading journal is only as good as the insights you pull from it.
This means you have to go beyond just logging entries and exits. You need to learn how to read the story your numbers are telling. This is how you finally separate what feels right from what is actually profitable, putting your performance under a microscope to spot hidden patterns, plug financial leaks, and double down on what works for you.
Turning Raw Data into Actionable Intelligence
Think of your journal as a goldmine. You need the right tools to sift through the dirt and find the valuable nuggets. That’s where Key Performance Indicators (KPIs) come in — they are the metrics that matter most, turning a simple logbook into a powerful analytical dashboard.
Here are the core numbers you should be laser-focused on:
- Win Rate: The most straightforward metric. It tells you what percentage of your trades are winners. While a high win rate feels great, it’s only a small piece of the puzzle.
- Profit Factor: This one is arguably more important. You get it by dividing your total gross profits by your total gross losses. A profit factor above 1.0 means you’re profitable; below 1.0 means you’re losing money, even if you win a lot.
- Average Win vs. Average Loss: This metric is a direct counter to the disposition effect — our tendency to cut winners short and let losers run. If your average win is smaller than your average loss, you’re doing exactly that, and it’s a recipe for disaster.
Analyzing these KPIs gives you a level of understanding your P&L alone never could. If you want to go deeper, check out our guide on how to calculate win rate and what it really says about your trading.
Using Tags to Uncover Your Best Strategies
The most powerful feature of any modern trading journal is the ability to tag your trades. Tags are just simple labels you attach to each trade, allowing you to slice and dice your performance data based on your specific strategies, setups, or even your mood that day.
It’s like running your own little science experiment. You have a hypothesis — for example, “The Opening Range Breakout strategy makes me money” — and tags are how you collect the hard data to prove or disprove it.
By tagging every trade with the exact setup you used, you can generate a performance report for each individual strategy. Suddenly, it’s not about gut feelings anymore. It’s about seeing hard data that says, “Strategy A has a profit factor of 1.8, while Strategy B is bleeding you dry at 0.7.”
This data-driven approach empowers you to make objective decisions. You can confidently put more capital behind the strategies that are statistically proven to work for you and cut the ones that consistently lose money.
From Common Pitfall to Data-Driven Solution
Many traders fall into the same psychological traps. A good trading journal doesn’t just record numbers; it provides a direct solution to these common, costly mistakes by forcing you to confront the data.
| Common Trading Pitfall | How a Trading Journal Helps | Relevant TradeReview Feature |
|---|---|---|
| Emotional Trading | Forces you to log the “why” behind a trade, making you aware of fear or greed. | Custom notes and tagging for psychological states (e.g., “FOMO,” “Revenge Trade”). |
| Ignoring Losers | Visualizes losses, making it impossible to ignore patterns of failure. | Performance reports that break down P&L by strategy, time, or setup. |
| Over-relying on Win Rate | Highlights Profit Factor and Risk/Reward, showing that winning isn’t everything. | The dashboard prominently displays KPIs like Profit Factor and Avg. Win/Loss. |
| Inconsistent Strategy | Helps identify which specific setups are truly profitable versus just “feeling” right. | Tag filtering allows you to isolate and analyze the performance of each strategy. |
By systematically addressing these issues with data, you move from being a reactive trader to a proactive one who is constantly refining their edge.
A Practical Example of Journaling in Action
Let’s look at a trader we’ll call Alex. Alex felt most confident trading mid-day reversals, but his account was slowly shrinking. He couldn’t figure out why. He started using a journal and tagged every single trade with its setup (“ORB,” “Reversal,” “Breakout”) and the time of day (“Morning,” “Mid-Day,” “Afternoon”).
After just one month, the data told him a story that completely contradicted his feelings.
- His “Mid-Day Reversal” trades had a 65% win rate, which made him feel successful. But the data showed the profit factor was only 0.85. His small, frequent winners were being completely erased by a few huge, stubborn losses he let run.
- On the other hand, his “Morning Breakout” trades — the ones he felt less sure about — had a lower win rate of 45% but a stellar profit factor of 1.9. When these trades worked, they really worked.
The journal made the problem impossible to ignore. Armed with this new insight, Alex stopped forcing the mid-day trades and shifted his entire focus to refining his morning breakout strategy. That single, data-driven change turned his performance around, proving the incredible power of moving from basic tracking to deep analysis.
Building the Discipline to Outlast the Statistics

The day trading success statistics we’ve gone through can feel pretty sobering. But they aren’t a life sentence — think of them as a benchmark. Beating the odds isn’t about finding some mythical, flawless strategy. It’s about building the discipline to execute a solid one, over and over again, especially when it’s emotionally difficult.
Success in trading is a marathon of inches, not a sprint for a lottery win. It’s won through patience, process, and a whole lot of self-review.
This means you have to make a fundamental mental shift. Stop treating trading like a hobby or a slot machine. It’s a business. And businesses have plans, track their expenses (losses), and measure everything to find an edge. Your trading deserves that same level of respect and long-term commitment.
Adopting a Professional Mindset
A professional trader doesn’t just show up and click buttons. They operate with a structured, systematic approach. This means detaching your ego from any single trade and focusing completely on the quality of your process.
The goal isn’t to be right every time. It’s to be consistently profitable over hundreds of trades.
This professional mindset is built on a few core pillars:
- Patience: You have to be willing to sit on your hands and wait for setups that meet every single one of your criteria. No more forcing trades out of boredom.
- Consistency: Apply your strategy and risk management rules on every trade, without exception. This is how you build trust in your system.
- Objectivity: Learn to see losses as a simple cost of doing business. Accept them, learn from them, and move on to the next opportunity without any emotional baggage.
Your Journal as an Accountability Partner
This is where a trading journal like TradeReview becomes more than just a notebook — it becomes your most crucial accountability partner. Think of it as the unbiased CEO of your trading business. It holds you to the standards you set for yourself.
A journal doesn’t care about your excuses or how you felt. It only reflects the reality of your actions.
The statistics tell us most traders fail. Your journal’s job is to tell you why you might be on that path and give you the data needed to change course. It transforms failure from a final verdict into valuable feedback.
Ultimately, nothing can guarantee success in the markets. The real goal is to build a systematic approach that dramatically improves your odds of survival and, eventually, profitability. The daunting statistics aren’t a reason to quit; they’re a challenge to be met with relentless discipline and the right tools.
Frequently Asked Questions About Trading Success
Stepping into the world of day trading always brings up some tough, but essential, questions. Let’s cut through the noise and get to some clear, straightforward answers about what success really looks like and how you can actually work to improve your odds.
What Percentage of Day Traders Are Actually Profitable?
If you look at the data, one thing becomes crystal clear: only a very small number of traders achieve lasting success. The exact numbers change from study to study, but a widely cited figure is that only about 1% of day traders manage to stay profitable over a five-year stretch.
Sure, short-term wins are more common, but when you factor in commissions, fees, and the emotional mistakes we all make, most people end up in the red. This isn’t meant to be discouraging — it’s a reality check that trading is a serious profession, not a slot machine.
How Does a Trading Journal Help Improve My Odds?
A trading journal is the tool that shifts you from gambling to running a business. By simply logging every trade — the setup you saw, why you took it, and how it played out — you’re building an objective database of your own performance.
This is how you find out what’s actually working, not just what you think is working. It lets you see your real risk-to-reward ratio, spot bad habits that are costing you money, and refine your edge. It’s the single most effective way to stop making blind guesses and start making decisions based on your own hard data.
A journal turns your trading into a feedback loop. Instead of repeating the same costly mistakes, you get the hard data needed to adapt, refine your strategy, and build a real edge over time.
What Is the Biggest Mistake That Causes Traders to Fail?
You can point to a lot of different mistakes, but the one that blows up more accounts than any other is simply poor risk management. It’s human nature for new traders to get fixated on how much they could make, while completely ignoring how much they could lose.
This mindset leads to taking positions that are way too big, not using stop-losses, or — the classic — holding a losing trade while hoping it will magically turn around. Without an ironclad plan for managing risk, just one or two bad trades can wipe you out. It’s a huge reason why those failure statistics are so high.
Ready to stop guessing and start analyzing? The first step to improving your own trading statistics is to start tracking them. TradeReview gives you the tools to log every trade, analyze your performance, and find your statistical edge — for free.


