So, what exactly is the Volume-Weighted Average Price (VWAP)? Think of it as the true average price a stock has traded at throughout the day, because it cleverly factors in both price and trading volume.
Unlike a simple moving average that treats every price point equally, VWAP gives more weight to the prices where the most shares changed hands. In short, it shows you where the real money was flowing.
Understanding VWAP and Why It Matters
Ever stare at a chart and feel like you’re just guessing whether you’re getting a good price? The market is a chaotic storm of flickering prices, and without a solid benchmark, it’s easy to get lost. We’ve all been there — buying too high or panic-selling too low simply because we lack a reliable anchor. This is where VWAP becomes your north star.
Let’s use a practical analogy. Imagine you’re trying to figure out the average price paid for a concert ticket. A simple average might tell you it’s $150. But what if only a handful of people paid $300, while a massive group of 1,000 fans bought their tickets in a block for $120? That simple average is suddenly pretty misleading.
VWAP fixes this. It gives far more importance — or “weight” — to the $120 price, since that’s where most of the tickets were actually sold. The resulting VWAP would be much closer to $120, giving you a more honest look at the ticket’s real value.
A Reliable Market Benchmark
VWAP does the exact same thing in the stock market. It tells you the average price paid per share for the day, adjusted for where the heaviest trading occurred. This is why it’s a go-to tool for big institutions and nimble day traders alike. It helps you answer crucial questions in real-time:
- Am I overpaying? If the current price is way above the VWAP line, you’re likely paying a premium compared to the average participant that day.
- Is this a good deal? A price below VWAP could signal a potential bargain, as you’re getting in cheaper than the volume-weighted average.
- What’s the market’s mood? When a stock consistently trades above its VWAP, it often suggests bullish strength. Trading below it can point to bearish pressure.
VWAP provides a real-time anchor in the chaotic sea of intraday price movements. It’s not about predicting the future; it’s about understanding the present context of price in relation to volume.
When you start seeing the market through this lens, you naturally shift away from emotional reactions and toward a more disciplined, data-driven approach. It becomes less about chasing every little price swing and more about strategically positioning yourself based on where the big money is moving. This mindset shift is the first step toward building habits that last.
How to Calculate VWAP Step by Step
That VWAP formula might look a little intense at first glance, but it’s actually built on a simple, logical idea. The goal is to find the average price, but with a twist: it gives more weight to the price levels where the most trading action happened.
You’ll likely never have to calculate it by hand — your charting platform does all the heavy lifting. But understanding the “why” behind it will give you a major confidence boost when you’re using it in the heat of the moment.
The whole thing breaks down into a simple, three-part process that just repeats itself over and over throughout the trading day.
This flow shows how the fundamental pieces — price and volume — are combined to create the balanced VWAP value.
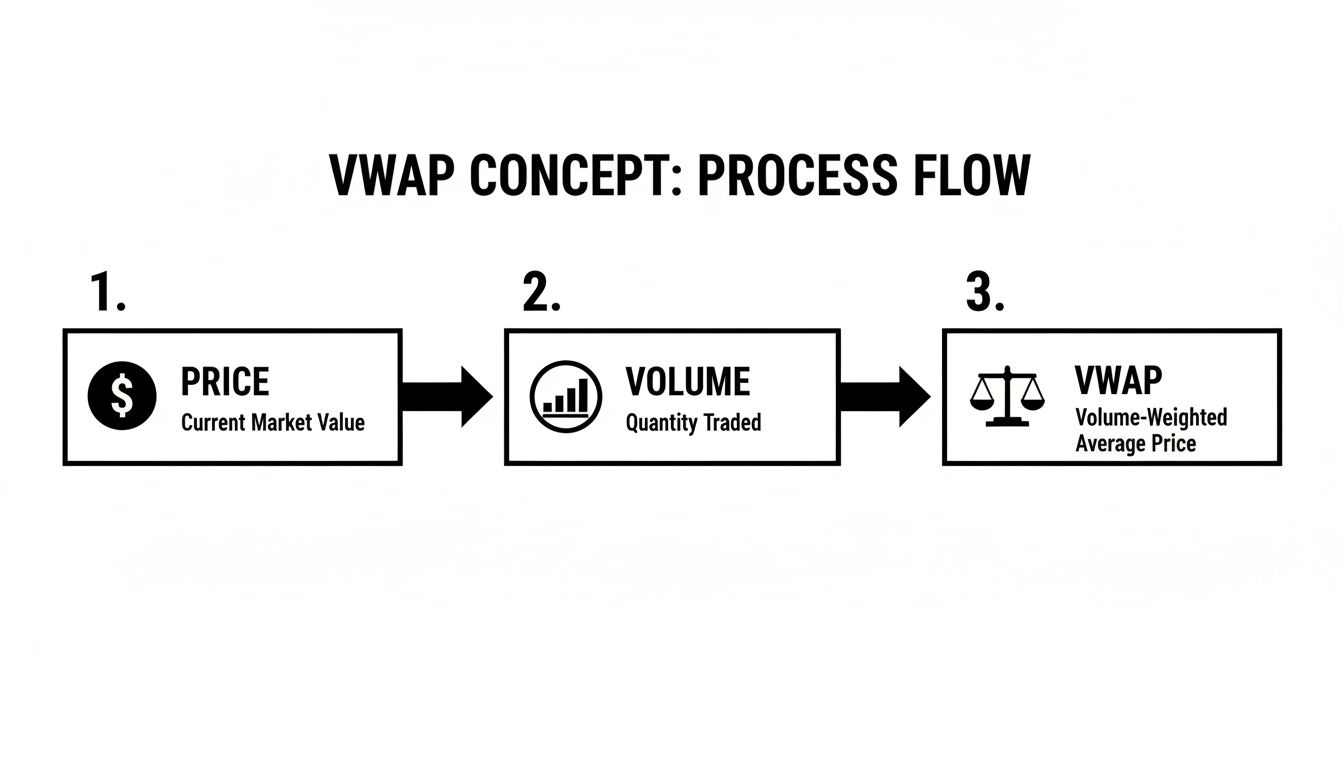
This visual really drives home the point that VWAP isn’t just about price. It’s about weighing that price against the actual volume of shares traded, which gives you a much truer measure of the day’s average transaction value.
The Three Ingredients of VWAP
To really get what VWAP is, you need to understand its core components. The entire calculation rests on grabbing three key pieces of data for each time period — say, every one-minute candle — of the trading day.
-
Calculate the Typical Price: First, you need a single, representative price for that period. The most common way to do this is to just find the average of the High, Low, and Close prices for that candle.
- Formula: Typical Price = (High + Low + Close) / 3
-
Multiply by Volume: Next, you take that Typical Price and multiply it by the number of shares traded during that same period. This gives you the total dollar value of all shares that changed hands.
- Calculation: Typical Price x Volume
- Use Cumulative Totals: Now for the secret sauce. VWAP doesn’t just look at one candle in isolation; it keeps a running total for the entire day. The formula is constantly adding the “Price x Volume” value from each new period to a running total, and it also keeps a separate running total of the day’s volume.
The final VWAP value at any given moment is simply the cumulative (Price x Volume) divided by the cumulative Volume.
Here’s the most critical thing to remember: VWAP resets every single morning. It’s a pure intraday indicator that starts fresh at the opening bell. This is exactly what makes it so valuable for analyzing a single session’s market behavior without any noise from previous days. It forces you to focus on the story the market is telling today.
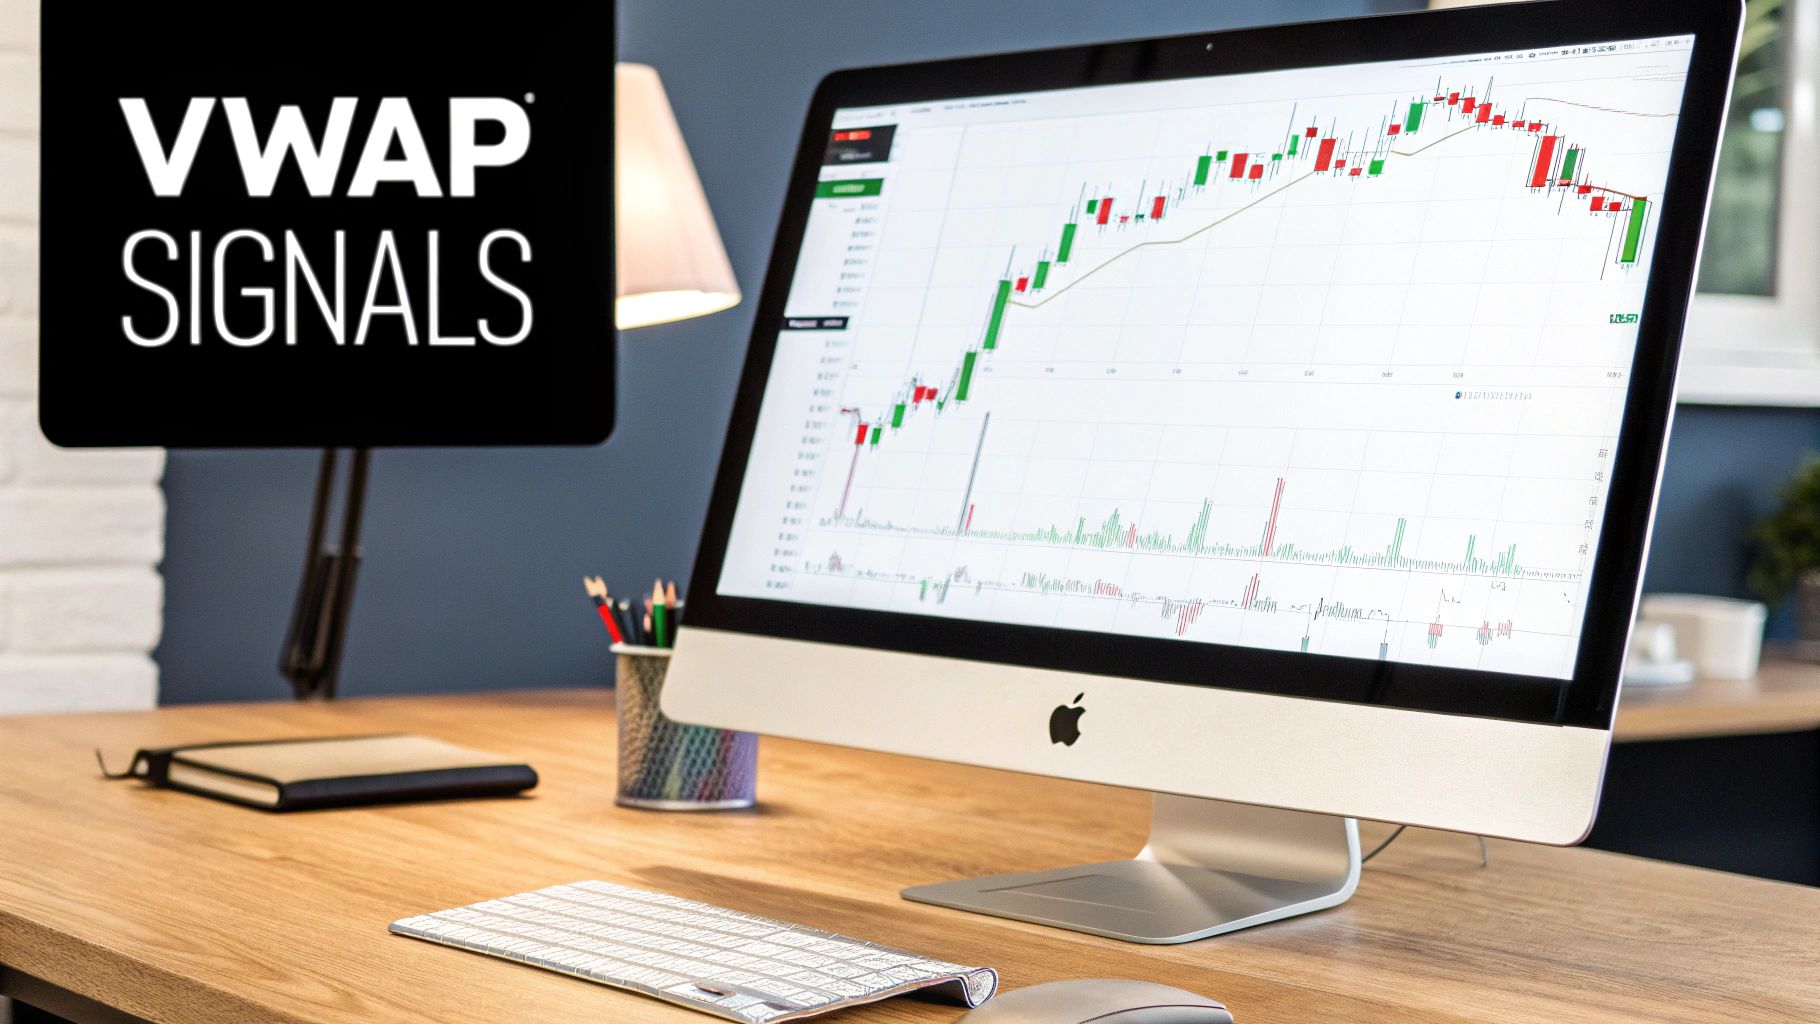
Using VWAP to Read Market Sentiment
It’s one thing to know the theory behind VWAP, but the real magic happens when you use it to make decisions in the heat of the moment. Think of the VWAP line as the market’s center of gravity for the day. The way price interacts with this line tells you a powerful story about who’s in control — buyers or sellers.
Every trader knows the feeling: a stock is running, and you’re torn between FOMO and the fear of buying the top. VWAP cuts through that noise. It gives you a clear, data-driven reference point, helping you trade with discipline instead of emotion.
Identifying Bullish and Bearish Trends
At its core, VWAP is a simple tool for gauging the intraday trend. The logic is straightforward, and it’s a great way to make sure you’re trading with the market’s momentum, not against it.
- Bullish Signal: When a stock’s price is trading consistently above the VWAP line, it’s a clear sign that buyers are in charge. They’re willing to pay more than the day’s average price, which signals strength.
- Bearish Signal: On the flip side, if the price is stuck below the VWAP, sellers have the upper hand. The average trader who bought that day is underwater, which often leads to more selling pressure.
This simple rule of thumb can act as a powerful filter, keeping you out of trades where you’re fighting a losing battle. For a practical example, a study on SSRN tested a basic VWAP crossover strategy on the QQQ ETF from 2018 to 2023. By simply going long when the price moved above VWAP and short when it fell below, an initial $25,000 portfolio could have hypothetically grown to almost $193,000. While these are backward-looking results and not a guarantee of future profits, they highlight how powerful a simple, disciplined rule can be over the long run.
VWAP as Dynamic Support and Resistance
VWAP is more than just a trend indicator; it often acts as a dynamic support and resistance level right on your chart. In a strong uptrend, you’ll often see the price pull back toward the VWAP line, find a wave of buyers waiting, and then bounce higher. This “reversion to the mean” can offer a solid entry for traders looking to get into a trend at a fair price.
VWAP isn’t a crystal ball that prints money. It’s a risk management tool. Its true power is giving you a logical framework for your trades, helping you sidestep emotional decisions.
Likewise, in a downtrend, a relief rally up to the VWAP might get smacked down by sellers, creating an opportunity to short the stock. This isn’t random. Institutional algorithms are often programmed to buy or sell large orders around the VWAP to get a good average price for their clients. It’s this “big money” activity that gives the level its weight.
When you learn to spot these patterns, you can time your entries and exits with much more precision. If you want to dive deeper, you might want to check out some more advanced VWAP trading strategies in our detailed guide. This is the kind of disciplined, strategic thinking that separates traders who last from those who burn out chasing every little move.
VWAP vs Moving Averages Key Differences
It’s an easy mistake to make. You see a line tracking the price on a chart and assume it’s just another moving average. But confusing VWAP with a Simple Moving Average (SMA) can be costly because they tell you two completely different stories about the market.
A moving average is basically a popularity contest where every vote counts the same. A 20-period SMA, for instance, just adds up the closing prices of the last 20 candles and divides by 20. It doesn’t care if one candle represented a million shares traded and another only ten thousand. It’s democratic, but sometimes that’s a flaw.
VWAP, on the other hand, is a meritocracy. It gives a much louder voice to the price levels where the real money changed hands. This is the whole game right here: VWAP is anchored by volume, while a moving average is anchored only by time. That’s what makes VWAP so powerful for understanding where the market’s true conviction lies during the trading day.
The Role of Volume
The single biggest difference is volume. An SMA completely ignores it. Imagine a stock slowly drifting higher on barely any volume — the SMA will dutifully climb, painting a rosy, bullish picture.
But VWAP knows better. It might barely budge, recognizing that the upward move lacks any real institutional muscle behind it. In this sense, VWAP acts like a truth serum for price action, helping you sidestep those head-fake moves that look good on the surface but have no real substance.
VWAP answers the question, “What is the true average price based on where the big money is trading today?” An SMA simply answers, “What was the average price over the last X periods?”
Intraday vs Continuous Calculation
Another critical difference is their lifespan. VWAP is a pure intraday indicator. It’s born at the market open and dies at the close. It resets every single morning. This daily reset is what makes it such a clean and reliable benchmark for day traders.
Moving averages, however, are continuous. A 20-day SMA on a daily chart is always looking back at the last 20 days, carrying baggage from previous weeks into the current price action. To get a better handle on how these work, check out our guide on how to use moving averages.
VWAP vs Moving Average A Comparison
To put it all in one place, this table breaks down the fundamental differences between VWAP and a Simple Moving Average (SMA). Understanding this will help you choose the right tool for the job.
| Feature | VWAP (Volume-Weighted Average Price) | Simple Moving Average (SMA) |
|---|---|---|
| Primary Input | Price and Volume | Price Only |
| Calculation | Cumulative for the current day only | Rolling average over a set period |
| Reset Period | Resets daily at market open | Continuous; does not reset |
| Best Use Case | Intraday trend, fair value benchmark | Longer-term trend identification |
| Market Insight | Shows price relative to trading activity | Shows price relative to its recent past |
Ultimately, it’s not about which indicator is “better” — it’s about asking the right question. If you want to gauge intraday sentiment and see where institutional players are active, VWAP is your go-to. For analyzing broader trends over days, weeks, or months, moving averages are still the industry standard.
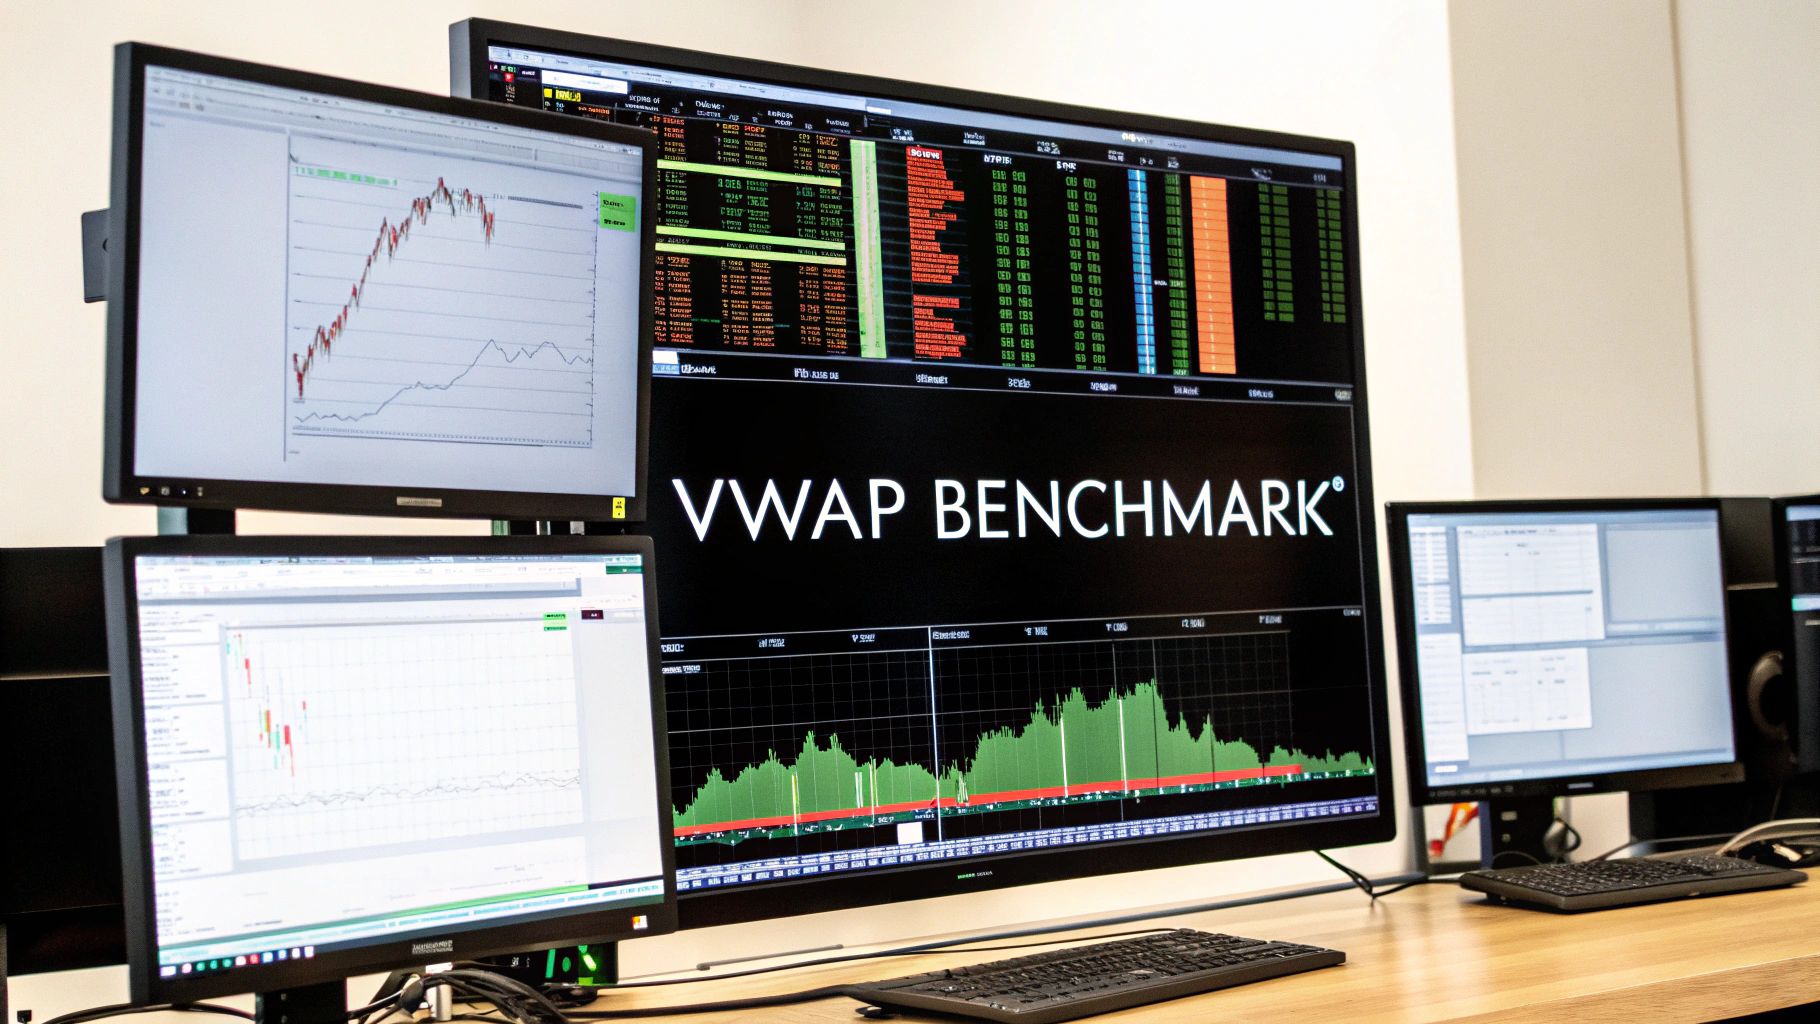
Why Institutional Traders Trust VWAP
Ever watch a stock’s price dance around the VWAP line all day and wonder why? It’s not magic. It’s because the biggest players on Wall Street — the pension funds, hedge funds, and massive banks — are all glued to that same exact line. For them, VWAP isn’t just another indicator; it’s a critical benchmark for their entire day’s work.
Picture trying to buy five million shares of a single stock. If you just slam the market with one giant order, you’ll instantly push the price up against yourself and get a terrible average cost. This is called market impact, and it’s a constant headache for large institutions. To avoid this, they have to break their massive orders into smaller, more manageable pieces throughout the day.
So, how do they know if they did a good job? They measure it against VWAP.
The Gold Standard for Execution
For an institutional trader, “success” is all about how well they executed their orders compared to the day’s average price. VWAP gives them the perfect yardstick to measure their performance.
- For Buyers: The mission is to build a position with a final average price below the day’s VWAP. This proves they got a better-than-average deal for their clients.
- For Sellers: Their goal is to offload shares with a final average price above the day’s VWAP, showing they secured a premium.
This intense focus on VWAP is so deeply ingrained in the industry that it’s become the standard benchmark. It’s been a cornerstone of institutional trading since 1984, when trader James Elkins first used it for a huge block trade in Ford Motor Company stock. Today, algorithms built around VWAP execute a significant portion of institutional trades. You can get a deeper dive into its history over on Wikipedia’s page on VWAP.
Once you understand that institutions are constantly trying to buy below VWAP and sell above it, you start to see why the price seems magnetically drawn to that line all day long.
What This Means for Your Trading
Realizing that institutions use VWAP as their guidepost gives you a massive strategic edge. You’re no longer just staring at a squiggly line on a chart; you’re looking at the battlefield where the big money operates.
This context is key to building discipline. Instead of getting shaken out by a sudden price spike, you can step back and ask, “Where is the price relative to the institutional benchmark?” This shift in perspective helps you align your trades with the market’s most powerful forces, transforming a simple indicator into a profound source of market insight.
Journaling Your VWAP Trades for Consistent Growth
A killer strategy is one thing, but executing it consistently is a whole different ball game. You can know the VWAP inside and out, but turning that knowledge into real, repeatable profit takes discipline. This is where journaling separates the pros from the hobbyists.
Think of your trading journal as the ultimate feedback loop. It forces you to look at the hard data of your performance, stripping away the emotional highs and lows. This isn’t about beating yourself up over a bad trade; it’s about finding the hidden patterns in your own trading behavior and sharpening your edge.
Creating a Data-Driven Feedback Loop
The secret is to get specific. Don’t just log a trade as “long” or “short.” You need to tag the exact setup. With a tool like TradeReview, you can create custom tags that bring your VWAP strategies to life.
- VWAP Breakout Long: For that explosive move when a stock clears the VWAP with conviction.
- VWAP Rejection Short: For when a stock tries to push through VWAP and gets smacked back down.
- VWAP Mean Reversion Buy: For buying that perfect dip to the VWAP line during a solid uptrend.
When you categorize every single trade like this, you start building a powerful dataset. This data will answer the questions that actually matter for your long-term growth.
The dashboard below is a great example of how a journal organizes all this information, giving you a crystal-clear picture of your P&L, win rate, and other crucial metrics.
This visual summary helps you see what’s working and what’s not at a glance, turning raw data into intelligence you can actually use. Over time, you’ll uncover which setups make you the most money, what time of day you trade best, and whether you have a bad habit of cutting your winners short.
A trading journal transforms every trade — win or lose — into a lesson. It’s the single most effective tool for building the discipline required to trade VWAP effectively over the long term.
This data-driven approach is non-negotiable for any serious trader. If you want to get started, you can even begin with something as simple as a trading journal template for Excel to start tracking your performance right away.
Common Questions About VWAP
As you start working with VWAP, a few common questions are bound to pop up. Nailing down the answers is key to using the indicator with confidence and avoiding some of the classic mistakes that can sting your P&L. Let’s clear up some of the most frequent ones.
Can I Use VWAP for Swing Trading?
The short answer is: not really. VWAP is an intraday animal, through and through. Its calculation starts fresh every single morning and ends when the closing bell rings. This makes it a go-to benchmark for day traders who need to understand the fair value for that specific day.
Swing traders, who are holding positions for days or even weeks, will get much more mileage out of indicators that smooth out data over longer periods, like a 20-day or 50-day moving average. Those tools are built to capture the bigger picture.
What Is the Best Timeframe to Use for VWAP?
This trips a lot of people up, but the answer is surprisingly simple. The VWAP line will be plotted in the exact same spot no matter which intraday chart you’re looking at. A 1-minute, 5-minute, or 15-minute chart will all show the identical VWAP level because it’s calculated based on the day’s total volume and price.
The timeframe you choose should be all about your personal trading style. A scalper might live on the 1-minute chart, watching for tiny bounces off VWAP. A trader looking for more established moves might prefer a 5-minute chart to cut through the noise and spot cleaner setups.
The magic of VWAP isn’t tied to a specific chart setting. It’s about recognizing its role as the day’s financial center of gravity, regardless of the lens you use to view the action.
What Is an Anchored VWAP?
Now this is where things get interesting. The Anchored VWAP is a powerful twist on the classic indicator. Instead of automatically resetting at the market open, it lets you pick any candle on the chart and start the calculation from there.
This is a game-changer for analyzing how the market has behaved since a specific, important event. For instance, you could anchor a VWAP to:
- The moment an earnings report was released
- A market-moving headline from a news event
- The candle that broke out of a major technical pattern
By anchoring it, you’re essentially asking, “What’s the volume-weighted average price since that thing happened?” This makes Anchored VWAP an incredible tool for both day traders and swing traders, extending its usefulness far beyond a single session.
Ready to stop guessing and start analyzing? TradeReview gives you the tools to journal your VWAP trades, dig into your performance with powerful analytics, and build the discipline every successful trader needs. Start your free trading journal today.