When you’re in the trading trenches, it’s easy to get overwhelmed by dozens of metrics. We’ve all been there, staring at charts and numbers, wondering what actually matters. But if you could only pick one metric to quickly gauge the health of your strategy, the profit factor would be a top contender.
Think of it as a simple, powerful health score for your trading. A profit factor above 1.0 tells you you’re making more money than you’re losing — which, at the end of the day, is the whole point. But getting there and staying there requires discipline and a long-term mindset, not a get-rich-quick scheme.
Your Guide to Understanding Profit Factor

The profit factor cuts right through the noise. It’s a performance metric that shows you the ratio of your total profits from winning trades to your total losses from losing trades. In other words, it answers the simple question: “For every dollar I’m losing, how many dollars am I making?”
Let’s break it down with a practical example. Imagine you had a trading month where your winning trades brought in a total of $10,000. It felt great, but during that same period, your losing trades cost you $5,000. Your profit factor would be 2.0 ($10,000 / $5,000).
In simple terms, this means you’re making $2 for every $1 you risk. That’s a solid, healthy sign. This isn’t just about a single good month; it’s about building a system that can produce these results consistently. You can dig deeper into this core metric on sites like Babypips.com.
A profit factor is more than just a number; it’s a reflection of your discipline. A consistently healthy profit factor shows that you’re not just getting lucky — you’re managing risk and executing a sound strategy.
This isn’t some abstract concept for Wall Street quants; it’s a practical tool for every trader. It directly answers the most critical question you can ask: “Is what I’m doing actually working over the long run?” Understanding this number is the first real step toward trading smarter, not just harder.
Profit Factor at a Glance
To make it even clearer, here’s a quick cheat sheet for interpreting your profit factor. It helps you instantly diagnose where your strategy stands, without sugarcoating the results.
| Profit Factor Value | What It Means for Your Strategy | Strategy Health Indicator |
|---|---|---|
| Below 1.0 | You are losing more money than you are making. This is a red flag. | Needs Immediate Review |
| Exactly 1.0 | You are at a break-even point. Wins and losses are perfectly balanced. | Stagnant |
| 1.1 – 1.5 | Your strategy is profitable, but there’s room for improvement in risk or execution. | Moderately Healthy |
| 1.6 – 2.5 | You have a strong, consistently profitable strategy with good risk management. | Very Healthy |
| Above 2.5 | Your strategy is performing exceptionally well. Stay disciplined and confirm it’s not a lucky streak. | Excellent |
Ultimately, a higher profit factor points to a more robust and effective trading plan. It’s a clear signal that your edge in the market is real and sustainable, not just a temporary hot streak.
How to Calculate Your Profit Factor

Thankfully, calculating your profit factor is refreshingly simple. There’s no complex algebra here — just a straightforward formula that gives you an honest look at your trading performance.
The formula is just this: Total Profits from Wins / Total Losses from Losses.
That means you only need two numbers from your trading journal: the sum of all your winning trades and the sum of all your losing trades. The key is being brutally honest with yourself; every single trade, even the small ones you’d rather forget, has to be included to get a true measure. We all have those trades, but ignoring them won’t help you improve.
A Practical Walkthrough
Let’s run the numbers together with a hypothetical trading log. Imagine a new trader, Alex, took these five trades over a week:
- Trade 1: +$150 profit
- Trade 2: -$75 loss
- Trade 3: +$200 profit
- Trade 4: -$50 loss
- Trade 5: +$100 profit
First, we’ll add up all the profits from the winning trades.
Step 1: Calculate Gross Profit
$150 (Trade 1) + $200 (Trade 3) + $100 (Trade 5) = $450
Next up, we do the same for the losses. Just add up the total amount lost and ignore the negative signs for this part of the calculation.
Step 2: Calculate Gross Loss
$75 (Trade 2) + $50 (Trade 4) = $125
Finally, we just plug those two numbers into the profit factor formula.
Profit Factor = Gross Profit / Gross Loss
$450 / $125 = 3.6
A profit factor of 3.6 is excellent. It shows that for every $1 Alex lost during this period, they made $3.60 back in profit. This kind of hands-on calculation removes the guesswork and shows you exactly where you stand.
If you want to dig deeper into the nuances of this process, there’s a helpful guide on calculating trading profit that explores the topic in more detail.
What a Good Profit Factor Really Looks Like
Okay, you’ve run the numbers and calculated your profit factor. If you see anything above 1.0, give yourself a pat on the back. That’s a great starting point, and it confirms your strategy is, at least on paper, profitable. Many traders struggle to even reach that point, so it’s a significant milestone.
But here’s the thing about the real world of trading: “on paper” often doesn’t cut it. A profit factor of, say, 1.2 might feel like a win, but it’s actually a bit of a danger zone. It leaves almost no wiggle room for the small, pesky costs that eat into your profits — things like commissions, slippage on your orders, or just a bad run of luck when the market gets choppy. Those little drains can quickly flip a slightly positive strategy into a losing one.
Aiming for a Professional Standard
This is why seasoned traders look for a much healthier cushion. Building a high profit factor is a marathon, not a sprint. It’s all about disciplined, steady refinement over time, not finding a perfect system on day one. So, if your number isn’t sky-high yet, don’t sweat it. Think of professional benchmarks as a goal to work toward.
A healthy profit factor is your strategy’s shock absorber. It’s what protects your account from the inevitable bumps and potholes you’ll hit in the market. A bigger buffer means more resilience.
Most experienced traders and automated systems aim for a profit factor of 1.75 or higher. This isn’t an arbitrary number; it’s a standard born from experience. A strategy with a lower profit factor is more fragile and less likely to survive long-term. You can find more great insights on what makes a good profit factor over at FundYourFX.
So, think of a higher number not as a requirement for today, but as a target for tomorrow. It’s a clear sign that your strategy is strong enough to not only survive but actually thrive through the market’s natural ups and downs.
Why Profit Factor Is Only Part of the Story
A high profit factor can feel like a trophy, a clear sign you’ve cracked the code. But we’ve all been there — a strategy looks amazing on paper but completely falls apart in a live market. Relying only on the profit factor without digging deeper is a classic — and costly — mistake. There are no guaranteed profits in trading, and a single number can’t promise future success.
For any trading strategy to be trustworthy, it needs more than just one impressive number; it needs a large sample size to back it up. A couple of lucky home-run trades can produce a stellar profit factor, but that’s not a reliable system. It’s just noise.
A high profit factor from a small number of trades is an observation, not a strategy. A solid profit factor over hundreds of trades is evidence of a real edge.
To build a professional, holistic view of your performance, you have to treat your trading like a business. That means looking beyond a single flashy metric and into the data that proves your strategy is consistent and resilient over the long haul.
Consistency Over Luck
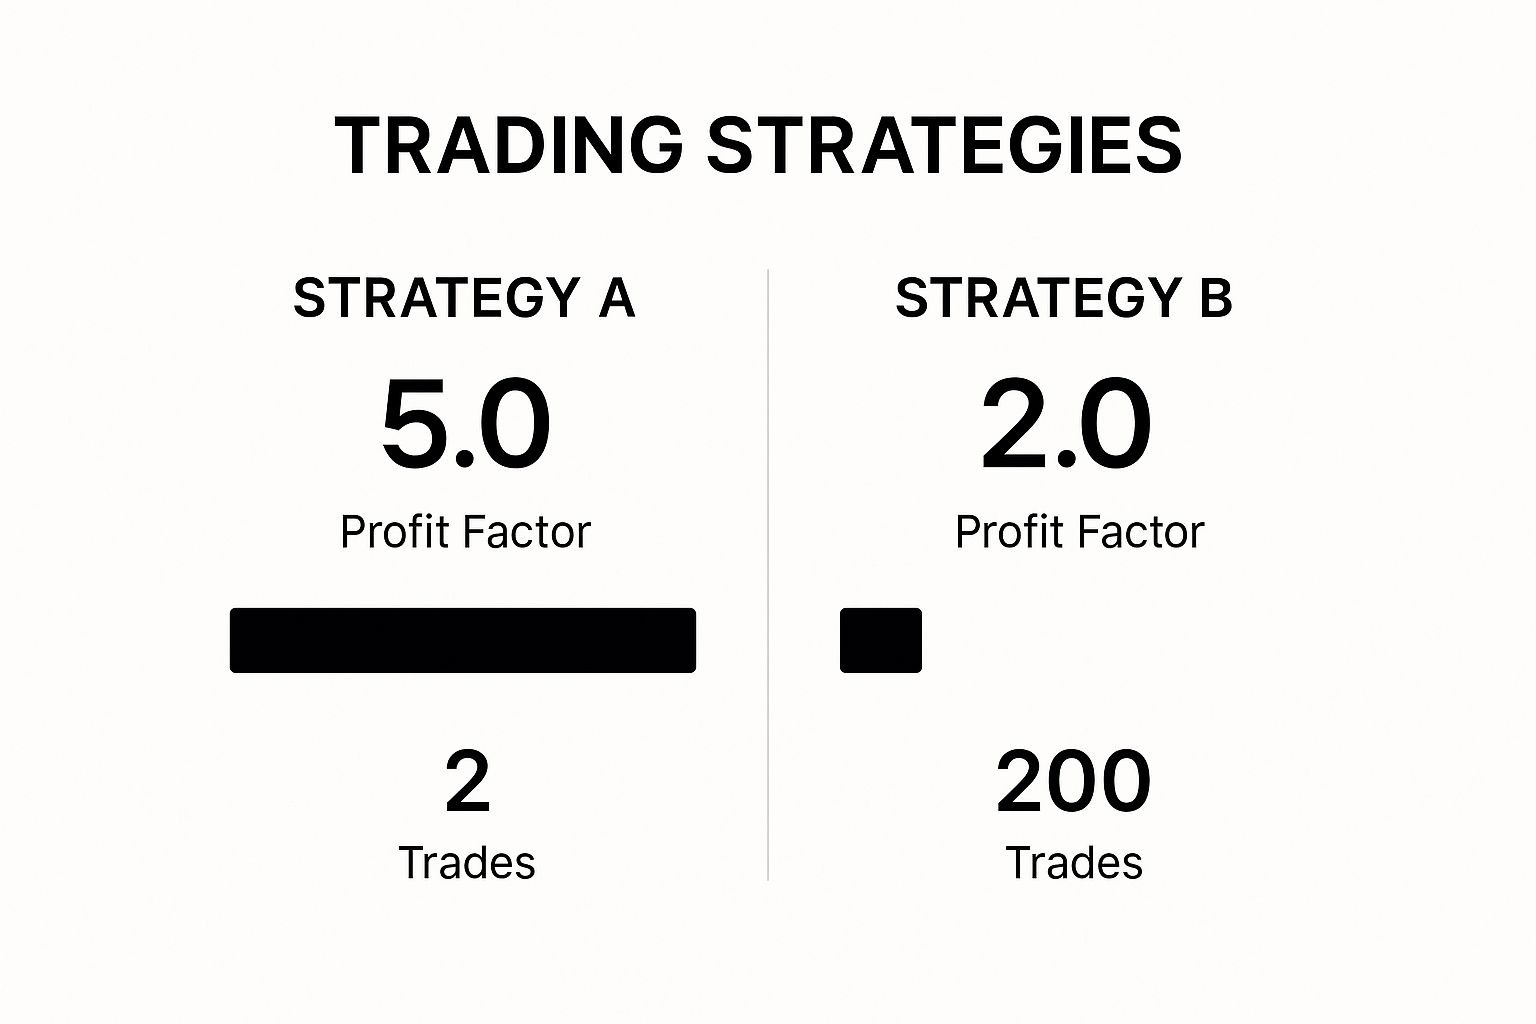
Let’s imagine you’re comparing two different trading systems. Strategy A has a massive 5.0 profit factor, while Strategy B has a more modest 2.0. At first glance, Strategy A looks like the clear winner. But what if that 5.0 score came from just two trades — one huge win and one tiny loss?
This infographic breaks down exactly why the number of trades is so critical for context.

As you can see, Strategy B’s 2.0 profit factor was calculated from 200 trades, proving it can perform consistently over time. It’s the battle-tested system, not the lottery ticket. True confidence in a strategy comes from seeing it perform again and again, through different market conditions.
Your Defense Is as Important as Your Offense
To get a true 360-degree view of your trading health, you need to pair your profit factor with other key metrics. Think of it this way: your profit factor is your offense — it shows your ability to score points. But a great offense is useless without a strong defense to protect your capital.
Here are a few key “defensive” metrics to watch:
- Max Drawdown: This number reveals the largest peak-to-trough drop your account has ever taken. It answers the painful but vital question: “How much could this strategy actually lose?” High drawdown can test your psychological limits, even if a strategy is profitable overall.
- Win Rate: This simply measures the percentage of your trades that are profitable. While it doesn’t tell the whole story, a healthy win rate points to consistency. You can learn more about how to calculate your win rate in our detailed guide.
A strategy with a high profit factor but a terrifying drawdown is a ticking time bomb waiting to blow up your account. On the other hand, a system with a moderate profit factor, a solid win rate, and a low drawdown is built for long-term survival and growth.
Building a Complete Picture of Performance
No single metric tells the full story. By combining profit factor with other key performance indicators (often called KPIs), you get a much clearer, more realistic view of your strategy’s true potential. This balanced analysis is essential for building a robust and successful trading approach.
| Metric | What It Tells You | Why It Complements Profit Factor |
|---|---|---|
| Max Drawdown | The biggest loss from a peak to a trough. | Gauges the psychological and financial risk of the strategy. |
| Win Rate | How frequently you win. | Shows the consistency of your edge, not just its size. |
| Average Win/Loss | The typical size of your winners vs. your losers. | Reveals if your profits come from many small wins or a few large ones. |
| Trade Frequency | How often the strategy generates signals. | Helps you understand if the strategy fits your trading style and schedule. |
By looking at these metrics together, you move from simply measuring past results to building a predictable, reliable trading system you can count on. It’s this complete picture that separates hobbyists from professionals.
Actionable Steps to Improve Your Profit Factor

Knowing your profit factor is a great start, but the real work begins when you start trying to improve it. Let’s be clear: boosting this number isn’t about finding some magic-bullet indicator. It’s about making small, disciplined adjustments that compound over time.
Think of it like tuning a high-performance engine. One tiny tweak might not seem like much, but a series of precise changes can unlock a whole new level of power. The same idea applies to your trading. You really only have two levers to pull: cutting your losses down and letting your winners grow.
Refine Your Risk Management
The fastest way to give your profit factor a lift is to shrink the denominator of the equation — your total losses. This means being absolutely ruthless about cutting losing trades short before they can do any real damage to your account. It’s painful, but it’s a non-negotiable part of the game.
Here are a few practical ways to tighten up your defense:
- Strict Stop-Loss Rules: Never, ever enter a trade without knowing exactly where you’ll get out if it goes against you. Set your stop-loss and treat it as sacred — don’t nudge it further away hoping for a miraculous turnaround. We’ve all been tempted, but discipline here is what separates profitable traders from the rest.
- Position Sizing: Dial back your size on trades you’re not 100% confident in. A smaller loss has a much smaller impact on your overall profit factor.
- The “One Bad Day” Rule: If you hit your max daily loss, just stop. Shut it down. This simple rule prevents one bad day from spiraling into a disastrous one, protecting both your capital and your sanity.
Remember, you don’t have to make back your losses on the very next trade. The goal is long-term profitability, and that always starts with disciplined loss mitigation and solid risk management techniques.
Let Your Winners Run
While controlling your losses is priority number one, the other side of the coin is just as important: maximizing your gross profit. So many traders mess this up. They get a little profit and immediately close the trade, terrified the market will reverse and take it all back. This habit absolutely stunts your profit factor’s growth.
A simple but incredibly effective tool here is the trailing stop-loss. This order automatically follows the price as it moves in your favor, locking in profits while still giving the trade room to breathe and grow. It takes the emotional guesswork out of the equation and helps you capture a much bigger piece of a winning move. That, in turn, directly pumps up the “profit” side of your profit factor calculation.
Tying It All Together
So, what do you do with this profit factor number now that you have it?
It’s easy to look at it as a final grade on a report card, but that’s not the point. Think of it more like a diagnostic tool — a mirror that gives you an honest, unfiltered look at the health of your trading strategy.
We’ve covered how to calculate it, what a good score looks like, and ways to bump it up. Now it’s time to shift your mindset. The goal isn’t to chase a perfect number. There is no magic formula that guarantees success.
Instead, use your profit factor to start asking better, more specific questions about your trading. Where are the leaks in my system? Which setups are actually making me money consistently?
The path to successful trading is paved with consistent analysis and a deep commitment to understanding your own performance. Your profit factor is one of your most honest guides on that journey.
Ultimately, this simple metric helps pull your focus away from the emotional rollercoaster of individual wins and losses and puts it squarely on the long-term health of your process. It’s a number that demands discipline and a professional approach, reminding you that real, sustainable success is built on data-driven decisions, not gut reactions to market noise.
A Few Common Questions
Even after you get the hang of profit factor, a few questions tend to pop up. Let’s tackle some of the most common ones so you can use this metric with confidence.
What’s a Good Profit Factor to Aim For?
Technically, anything over 1.0 means your strategy is profitable. But in the real world, that’s not enough.
Most seasoned traders look for a profit factor of 1.75 or higher. Why? Because that extra cushion absorbs the unavoidable costs of trading — things like slippage (when your trade executes at a slightly different price than you expected) and commissions that can silently eat away at your returns. A higher number points to a more robust system that can withstand the unpredictable nature of the markets.
Can a High Profit Factor Be a Trap?
Absolutely. A sky-high profit factor can be dangerously misleading if it’s based on just a handful of trades.
Think about it: a 4.0 profit factor from only three trades is far less impressive than a steady 2.0 profit factor calculated over 300 trades. Always look at the sample size. A flashy number from a short lucky streak means nothing; consistency over time is what truly matters.
Key Takeaway: A trustworthy profit factor is built on a foundation of consistent performance over a significant number of trades, not on a handful of outlier wins.
How Often Should I Check My Profit Factor?
Don’t drive yourself crazy checking it after every single trade — the number will jump around too much to be useful. This can lead to emotional decisions, which is something we want to avoid.
Instead, step back and analyze it periodically. Reviewing it weekly, monthly, or after every 50-100 trades gives you a much more stable and meaningful picture of how your strategy is really doing. This helps you make smart adjustments without overreacting to short-term market noise.
Ready to stop guessing and start analyzing? TradeReview gives you the performance analytics you need, like profit factor and win rate, all in one clear dashboard. Sign up for free and get the data-driven insights you need to trade smarter.


