At its core, trading journal software is a dedicated tool that helps traders log, track, and analyze their trades. Think of it as your personal data-driven coach, turning every trade you make — good or bad — into a clear, actionable insight. It’s about building a system for improvement, not just chasing quick wins.
Why Data Beats Gut Feeling in Trading
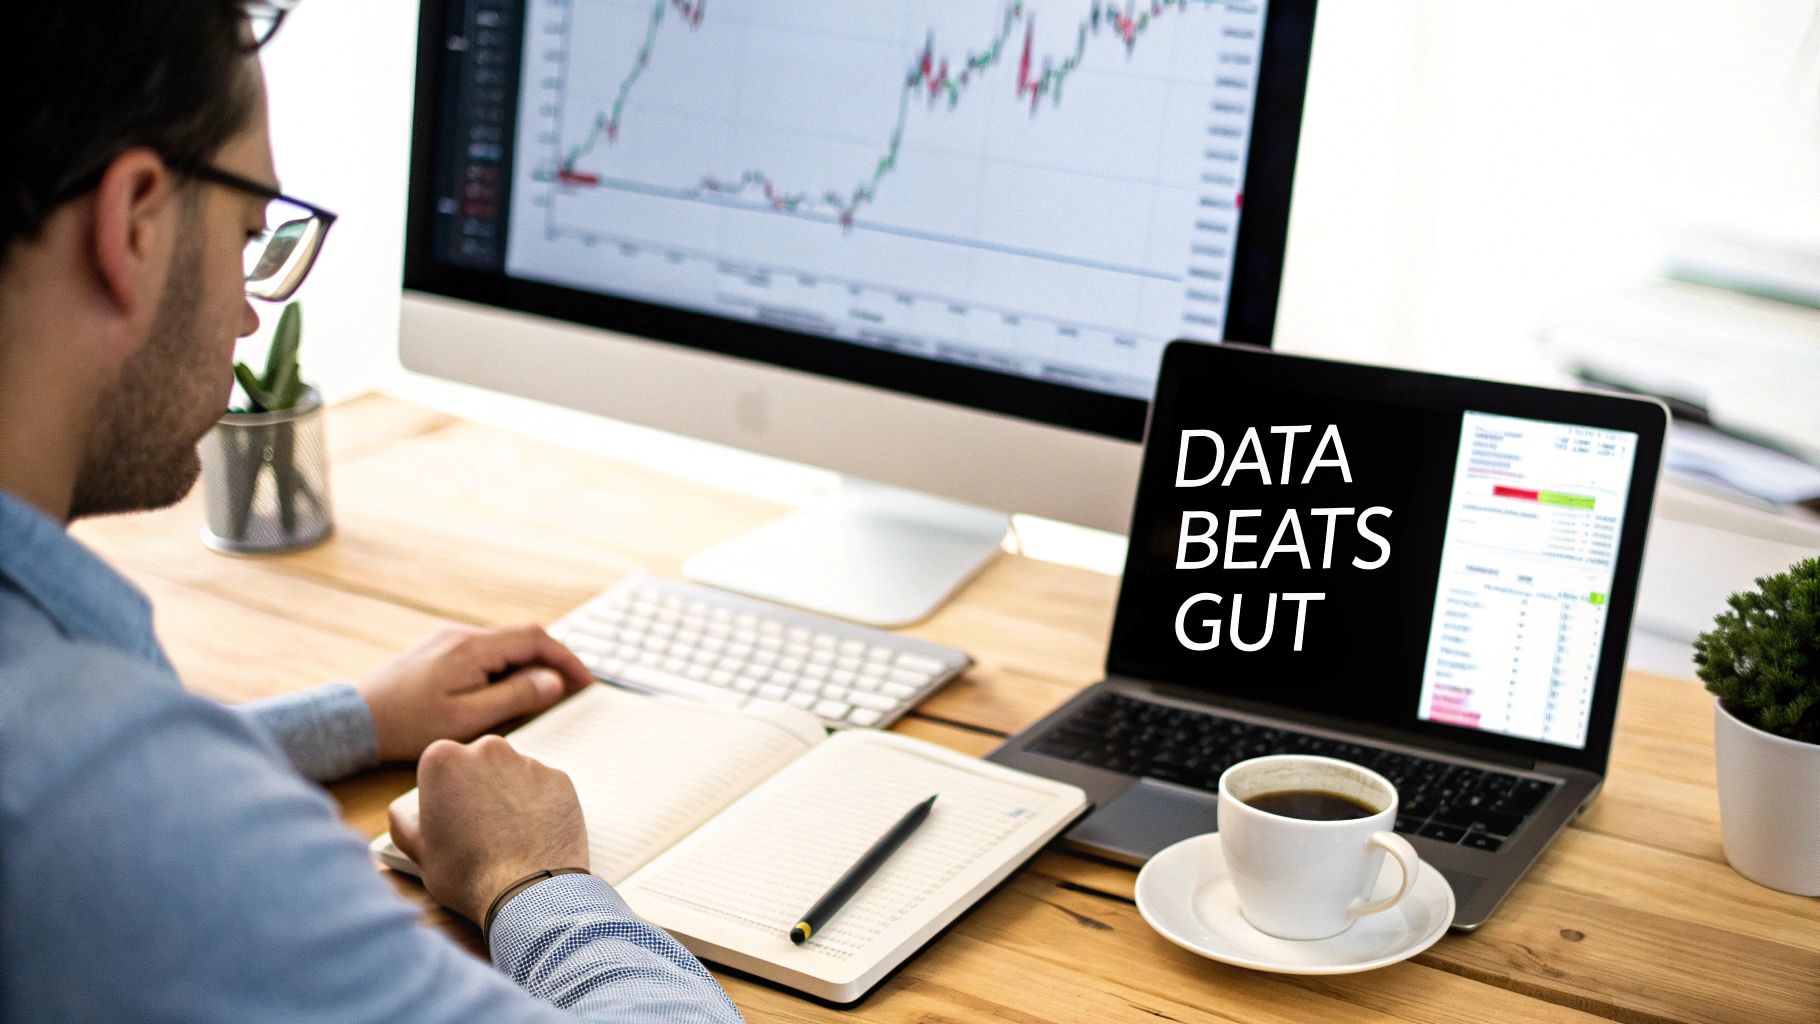
If you’ve ever placed a trade based purely on a “gut feeling,” you know the emotional rollercoaster that follows. Maybe you held a losing position too long, hoping it would turn around. Or you closed a winning trade way too early, terrified of giving back profits. This is the reality for most traders, and it’s an exhausting way to navigate the markets.
Relying on intuition and memory is like a professional athlete competing without ever watching their game footage. It’s a recipe for inconsistent results.
The market is a game of probabilities, not certainties. Our memory is notoriously unreliable; we tend to glorify our biggest wins while conveniently forgetting the small, repetitive mistakes that slowly bleed our accounts. This is exactly where trading journal software steps in to become your most valuable ally.
The Bridge from Guesswork to Strategy
A trading journal is so much more than just a list of wins and losses. It’s a systematic tool for self-reflection that forces you to look at your real performance, completely free from emotional bias. By meticulously recording every trade, you start building a rich dataset of your own trading behavior.
A journal is your roadmap, your coach, and your mirror all in one. It transforms subjective feelings into objective data, showing you what works, what doesn’t, and most importantly, why.
Without this hard data, you’re just guessing. You might feel like you’re a great trader on Tuesdays or that a particular chart setup always works out, but you can’t know for sure. A journal gives you the proof.
Building Long-Term Discipline
Discipline is the absolute cornerstone of sustainable trading, and a journal is the ultimate accountability partner. It creates a structured, professional approach by helping you:
- Spot Costly Patterns: Do you find yourself consistently losing money on Fridays? Are you prone to impulsive “revenge trades” right after a loss? The software will bring these destructive habits into the light.
- Refine Your Edge: By tagging trades with your specific setups (e.g., “breakout,” “reversal,” “mean reversion”), you can quickly see which strategies deliver the highest win rate and profit factor. This lets you double down on what truly works.
- Master Your Emotions: Simply noting your mindset before, during, and after a trade helps you connect your emotional state to your financial results. This self-awareness is critical for taming the fear and greed that derail so many traders.
Ultimately, committing to a trading journal is a commitment to your long-term growth. It shifts your focus from the random outcome of a single trade to the quality of your decision-making process over hundreds of trades. This guide will walk you through everything you need to know, from basic logging to advanced performance analysis, helping you build a disciplined, data-backed trading routine.
How Trading Journals Evolved From Spreadsheets
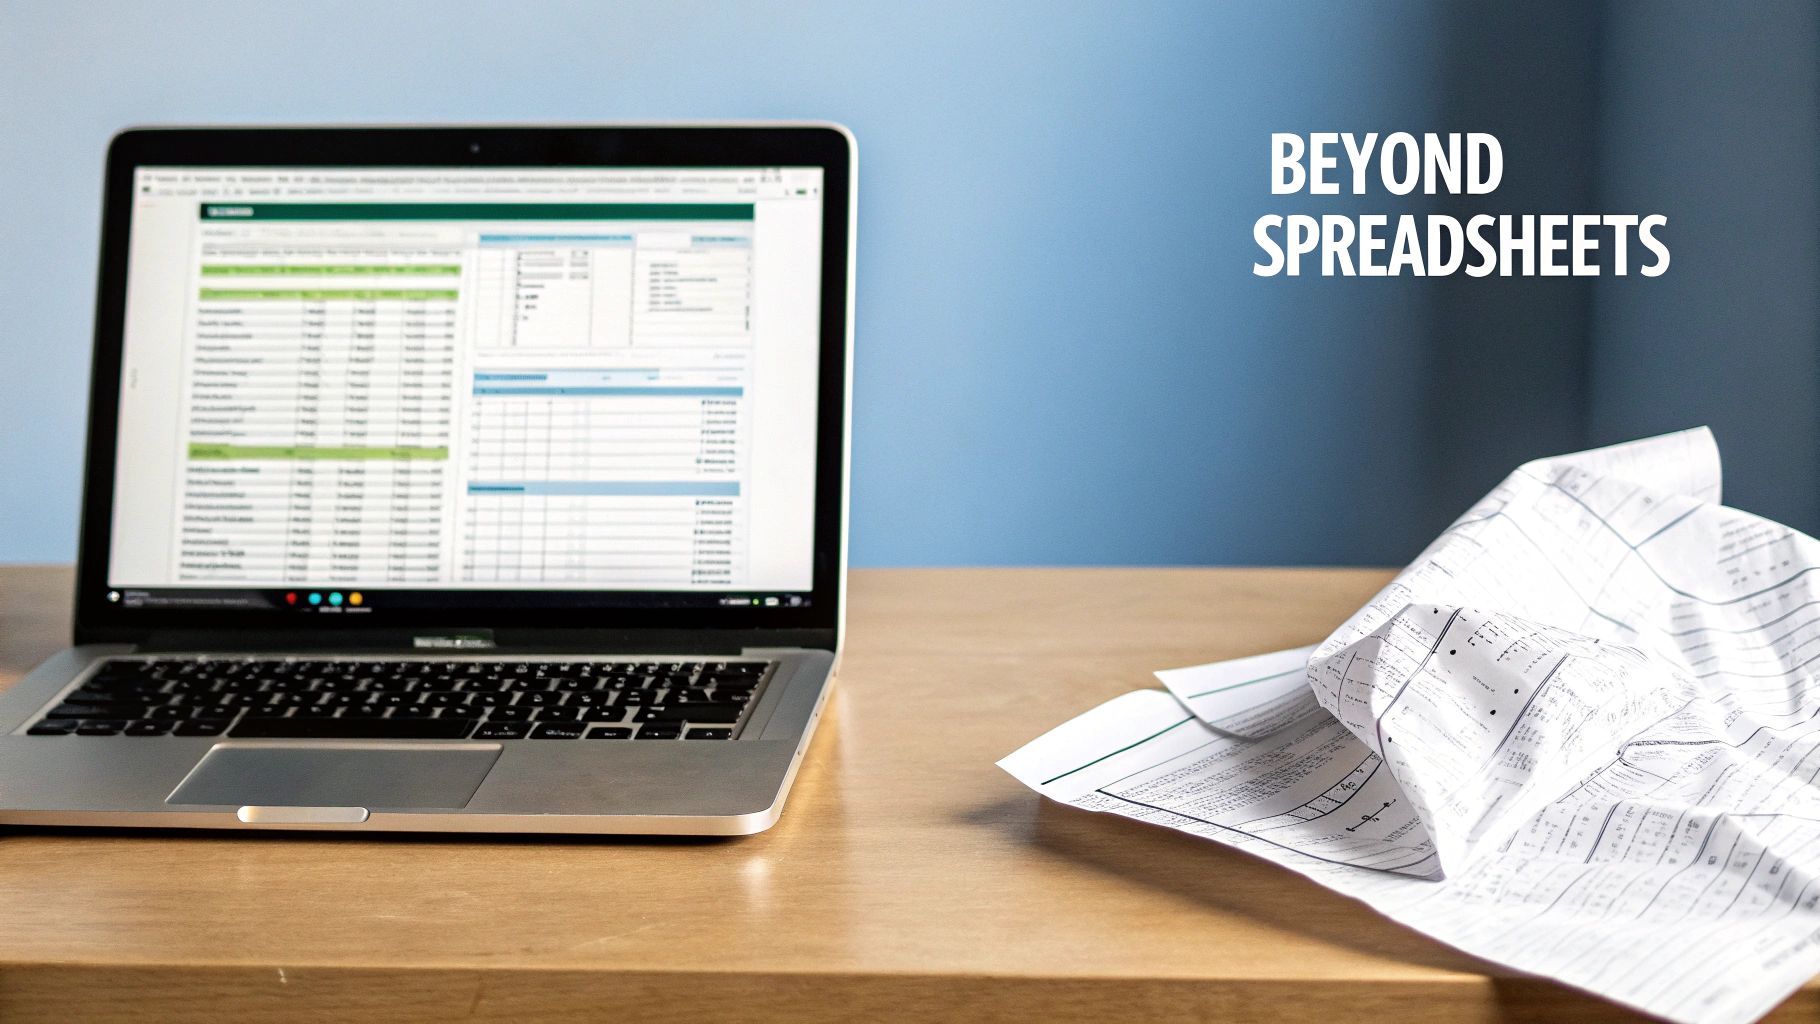
For a long time, the humble spreadsheet was the go-to for any disciplined trader. Let’s face it, it was a huge upgrade from a paper notebook. It gave us a structured way to log entries, exits, profits, and losses.
Plenty of traders still start out this way. It makes sense — spreadsheets are familiar, accessible, and seem simple enough at first.
But anyone who’s stuck with a trading spreadsheet for a while knows the real story. It’s a grind. After a long, mentally draining day in the markets, the last thing you want to do is spend another hour punching in every single trade detail by hand.
This constant data entry isn’t just a drag; it’s a breeding ground for mistakes. One tiny typo in a formula or a misplaced decimal point can throw your entire performance analysis off track. That’s how you end up making bad decisions based on bad data.
The Limits Of Manual Tracking
Trying to manage your trading with a spreadsheet is like trying to build a new car from scratch every morning just to drive to work. Sure, it’s possible, but it’s wildly inefficient and bound to break down.
The cracks start to show almost immediately.
- It’s a Time Sink: Manually typing in dozens of trades — especially for active day traders — eats up precious time you could be using to study charts or refine your actual strategy.
-
Formula Frustration: Building and maintaining formulas for metrics like profit factor, win rate, or average R:R is a headache. One broken
VLOOKUPor a dreaded#REF!error can bring your entire analysis to a screeching halt. - Zero Visual Insight: Spreadsheets are great with raw numbers, but they’re terrible at telling a visual story. Trying to generate a clean equity curve or spot performance patterns takes some serious spreadsheet wizardry.
Spreadsheets log what happened, but they struggle to show you why it happened. They capture the raw numbers but leave the deeper story buried in rows and columns of static data.
This is exactly the gap that modern trading journal software was designed to fill. It’s a quantum leap forward, moving you from manual logging to automated analysis and freeing you from the busywork.
The Automation Revolution
The shift from spreadsheets to specialized software is all about changing your focus from data entry to data analysis. Instead of burning hours logging trades, you can spend minutes reviewing insights that are generated for you. This kind of software connects directly to your broker, pulling in all your trade data perfectly in seconds.
This automation brings a whole new level of clarity. Suddenly, your performance analytics are calculated instantly and accurately. Your equity curve updates in real time, giving you immediate visual feedback on how you’re doing.
This isn’t some niche tool anymore; traders are increasingly seeking out tools that help them analyze and improve their performance, moving away from tedious manual work. To see just how different the two approaches are, check out our deep dive into a trading journal in Excel versus dedicated software.
Ultimately, modern platforms like TradeReview do the heavy lifting. This lets you put your energy where it actually counts — making smarter, more informed trading decisions based on clean, reliable data.
Core Features Of Advanced Trading Journal Software
When you move past a basic spreadsheet, you unlock a world of features built to give you a real edge in the markets. The best trading journal software isn’t just a place to log trades; it’s a powerful analysis tool that handles the grunt work for you, revealing the insights that actually move the needle.
Knowing what to look for is key. Let’s break down the must-have features that separate a simple logger from a professional-grade trading journal.
Automated Broker Synchronization
Let’s be honest: after a long day of trading, the last thing anyone wants to do is spend an hour manually entering every single trade. This is the #1 reason most traders give up on journaling.
That’s where auto broker sync comes in. It’s a total game-changer. This feature connects your journal directly to your brokerage account and pulls in all your trade data automatically. No more typos, no more forgotten trades, and no more wasted time. It’s the foundation for a consistent journaling habit, ensuring your data is always accurate so you can focus on analysis, not admin work.
Advanced Performance Analytics
A journal’s real magic is its ability to turn raw data into actionable intelligence. A spreadsheet might show your profit and loss, but advanced software digs much deeper, calculating the key performance indicators (KPIs) that tell the true story behind your results.
A good platform will have a clear, visual dashboard with metrics like:
- Win Rate: Simple, but only gives you part of the picture.
- Profit Factor: This is your total profits divided by your total losses. Anything above 1.0 means you’re profitable, but a solid system usually has a profit factor of 1.5 or higher.
- Average Win vs. Average Loss: Are your wins big enough to cover your losses? This metric shows if you’re cutting losers and letting winners run — the hallmark of a disciplined trader.
- Equity Curve: This chart of your account balance over time gives you an instant, at-a-glance read on your consistency and overall performance.
These analytics help you stop asking “Did I make money?” and start understanding “How and why did I make money?”
A great journal doesn’t just show you your results; it reveals your habits. It connects your actions to your outcomes, making it impossible to ignore the patterns that are either building or draining your account.
Flexible Tagging And Categorization
This is easily one of the most powerful features for deep-diving into your strategy. Tagging lets you add custom labels to every trade, creating categories for your different setups, market conditions, emotional states, or even common mistakes.
Want to know how your “opening range breakout” strategy performs on high-volatility days compared to quiet ones? With tags, you can filter your results and get an answer in seconds.
Practical Example: Tagging Emotional Errors
A trader notices they tend to make impulsive trades right after a big loss — a classic case of “revenge trading.”
- They create a custom tag: #revenge-trade.
- Every time they catch themselves making one of these emotional trades, they apply the tag.
- After a month, they filter their analytics for the #revenge-trade tag. The data is brutal: these trades have a 25% win rate and a profit factor of 0.4, making it their single most destructive habit.
This kind of objective data is the proof you need to build rules to stop this behavior, like setting a mandatory cool-down period after a significant loss.
Before we move on, it’s helpful to see just how different a dedicated tool is from a simple spreadsheet.
Feature Comparison Basic vs Advanced Trading Journal Software
| Feature | Basic Journal (e.g., Spreadsheet) | Advanced Software (e.g., TradeReview) |
|---|---|---|
| Data Entry | Manual; prone to errors and omissions | Automated broker sync; accurate & complete |
| Analytics | Basic P&L, manual calculations | Deep KPIs, equity curve, visual dashboards |
| Strategy Analysis | Difficult; requires complex formulas | Flexible tagging and filtering |
| Accessibility | Limited to one device | Cloud-based sync across web and mobile |
| Security | Local file security only | Industry-standard encryption |
The difference is clear. While a spreadsheet is a start, advanced software is what gives you the tools to truly analyze and improve your performance.
Multi-Device Access And Sync
The market doesn’t wait for you to get back to your desk, and your journal shouldn’t either. The best trading journal software syncs seamlessly across all your devices — web, iOS, and Android.
This means you can log a quick trade on your phone, add notes on your tablet later, and do a deep-dive review on your desktop that night. Your data is always up-to-date and accessible, so you can capture critical insights the moment they happen.
Robust Data Security
Your trading data is sensitive stuff. Handing it over to a third-party platform means you need to trust their security. This is not a feature to gloss over.
A reputable provider will use industry-standard encryption to protect your data both “in transit” (as it moves to their servers) and “at rest” (while it’s stored). Look for platforms that are upfront about their security practices — it shows they’re serious about protecting your privacy.
For a closer look at what to expect from the top options, check out our detailed guide on the best trading journal platforms available today.
Build A Disciplined Trader Workflow
Owning a great piece of trading journal software is a bit like having a high-performance race car. It’s packed with potential, but it’s not going to win any races without a skilled driver who has a clear plan for every lap. The software gives you the data; your workflow is what turns that data into disciplined, thoughtful decisions.
We’ve all had those days where one bad trade snowballs into an emotional mess, wrecking our P&L. A structured workflow is your anchor in those moments. It grounds you in logic when your emotions are trying to take the wheel.
Let’s walk through a simple, four-step routine that turns your journal from a dusty old logbook into your most trusted accountability partner.
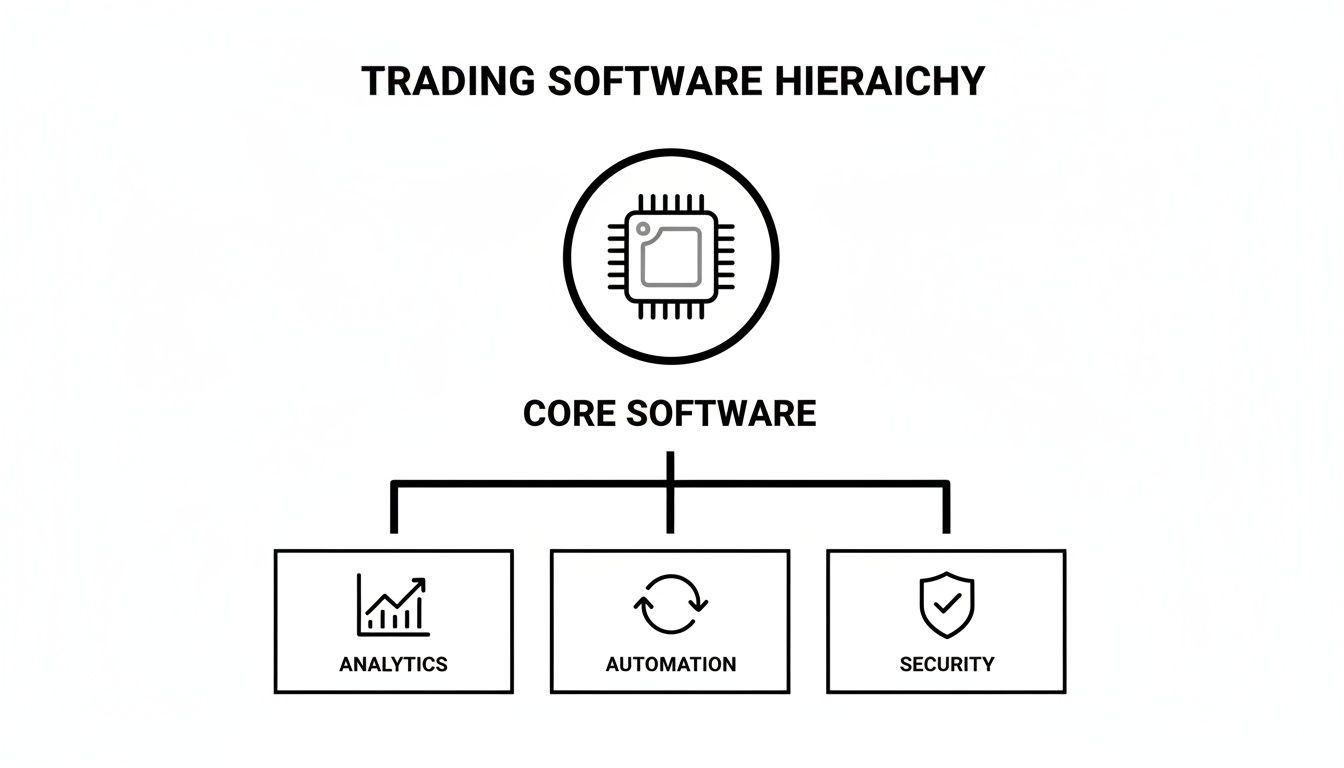
This diagram shows how everything fits together — the core features are backed by solid analytics, smart automation, and robust security to create a workflow you can actually count on.
Step 1: Pre-Market Preparation
Your trading day shouldn’t kick off when the opening bell rings. Real preparation starts long before that, with your journal as your guide. This is your time to tune out the market noise and tune into your own performance.
Take a look at your last few trades, paying special attention to your biggest wins and most painful losses. What jumps out? Are your best trades all coming from a specific setup? By starting with your own data, you reinforce what works for you and prime yourself to execute a plan, not just react to the chaos.
Practical Example: A trader opens their journal before the market opens and notices their last three big losses all came from chasing stocks that were already way up. They set a simple rule for the day: “I will not enter any stock that is more than 5% above its 20-day moving average.” This isn’t a random rule; it’s a boundary created from their own hard-won data.
Step 2: Intraday Logging and Tagging
The heat of the trading day is the absolute worst time to rely on your memory. Your brain is juggling dozens of variables while fear and greed are whispering in your ear. Jotting down your thoughts and actions as they happen is the only way to get an honest review later.
This doesn’t have to be a novel. A few quick tags or a short note is perfect. Most modern trading journal software makes this super easy. Just note why you entered, how you were feeling, and if you broke any of your rules. It’s an immediate feedback loop that’s simply priceless.
The most honest version of yourself is the one making decisions under pressure. Capturing those thoughts in real-time is the only way to truly understand the psychology driving your results.
Step 3: End-Of-Day Review
Once the market closes, the real work begins. Think of this as your post-game analysis while the day’s plays are still fresh in your mind. Go through every single trade and compare what actually happened with what your plan said should have happened.
This is where you connect your actions to your outcomes. Did you stick to your pre-market rule? Did you cut that loser when your stop was hit, or did you give it a little more room “just in case”? This daily ritual isn’t about judging the P&L; it’s about grading your execution. It’s how you build self-awareness and forge discipline, one trade at a time.
Step 4: Weekly and Monthly Deep Dives
Daily reviews are for fine-tuning, but weekly and monthly reviews are for finding your strategic edge. This is where you zoom out to see the big picture and spot the recurring patterns that truly define you as a trader.
Fire up your software’s analytics and filters to get answers to the big questions:
- Which of my setups is actually making me money? Filter by your strategy tags and look at the win rate and profit factor for each one.
- What day of the week am I at my best (or worst)? It’s common for traders to find out they consistently lose money on Fridays and decide to trade smaller or just take the day off.
- What are my most expensive bad habits? Filter by tags like “#FOMO-entry” or “#revenge-trade” to see exactly how much those emotional slips are costing you.
This big-picture analysis is how you stop making the same mistakes and start building a real, sustainable edge. Each step in this workflow feeds into the next, creating a powerful cycle of continuous improvement — all powered by your own trading data.
How TradeReview Sharpens Your Trading Analysis
It’s one thing to know what features a good trading journal software should have, but it’s another thing entirely to see how those features solve your biggest trading headaches. A great tool shouldn’t feel like a chore. It should feel like a partner, connecting the dots between your actions and your P&L, turning hours of tedious work into minutes of crystal-clear insight.
That’s exactly how TradeReview is designed to fit into your workflow. It does the heavy lifting for you, so you can focus on what actually matters: making smarter, more informed decisions.
From Manual Entry To Automated Insights
Let’s be honest — the biggest hurdle to keeping a consistent journal is the sheer effort involved. After a long, draining day staring at charts, the absolute last thing you want to do is spend another hour manually punching in every entry, exit, and commission fee.
TradeReview gets rid of this problem with Auto Broker Sync. Instead of logging trades one by one, you just connect your brokerage account, and all your trade data flows right into your journal, completely automatically. This not only saves you a massive amount of time but also eliminates the typos and human errors that can skew your analysis.
This single feature is the foundation of a journaling habit that actually sticks. It guarantees your data is always accurate and complete, giving you a reliable source of truth to work from.
A journal is only as good as the data inside it. By automating the most tedious part of the process, TradeReview makes it effortless to build a rich, accurate history of your trading decisions.
Find Your Edge With Performance Analytics
Are you really letting your winners run? Is your go-to strategy killing it on Tuesdays but bleeding money on Fridays? These are the kinds of questions that separate struggling traders from consistently profitable ones, and TradeReview’s Performance Analytics dashboard is built to give you the answers.
Instead of getting lost in a messy spreadsheet, you get an immediate, visual snapshot of your most important metrics:
- Win Rate: See exactly how often your trades are profitable.
- Profit Factor: Instantly know if your winning trades are big enough to outweigh your losers.
- Equity Curve: Watch your account’s growth over time with a simple, at-a-glance chart.
This dashboard turns your raw data into a story about your trading habits. You can finally stop guessing where you’re going wrong and start knowing where your real strengths and weaknesses are. For a deeper look at how this all comes together, check out our introduction to TradeReview’s features.
See Your Patterns On The Visual Trade Calendar
Sometimes, the most powerful insights are hiding in plain sight. TradeReview’s Visual Trade Calendar helps you spot time-based patterns that are almost impossible to see in a standard log.
Here’s a practical example: A trader has a gut feeling that their weeks always get off to a rough start. By glancing at their Visual Trade Calendar, they see a sea of red every Monday. A quick filter confirms it: their win rate on Mondays is a dismal 35%, compared to 62% on Wednesdays and Thursdays.
Armed with this data, they decide to cut their position sizes way down on Mondays and focus more on observation. This one small tweak, driven by a simple visual insight, helps them plug a major leak in their account.
This calendar highlights your performance day by day, helping you understand how your personal trading rhythm lines up with the market’s. This kind of data-driven decision-making is becoming essential, as detailed performance tracking is increasingly a standard practice for serious traders.
Stay Connected With Multi-Platform Access
Trading opportunities don’t just happen when you’re sitting at your desk, and your journal shouldn’t be chained there either. With TradeReview, all your data syncs seamlessly across web, iOS, and Android devices.
This means you can jot down a quick note on your phone the second you close a trade, add screenshots from your tablet while you’re on the go, and then sit down for a full, in-depth review on your desktop that evening. Nothing gets lost in the shuffle, and your journal is always up-to-date, no matter where you are.
Trading Journal Software: Your Questions Answered
Even when you see the value in a new tool, it’s totally normal to have a few questions before you dive in. Let’s tackle some of the most common things traders ask when they’re thinking about using trading journal software.
Is This Really Just for Day Traders?
Absolutely not. It’s true that high-frequency day traders get a huge, immediate benefit from logging every move, but the real power of journaling is universal. Swing traders, options traders, and even long-term investors can find a serious edge by tracking their decisions.
Think about it: a swing trader might finally figure out why they’re always cutting winning trades short after a few weeks. An options trader could tag their iron condors versus their credit spreads and see which strategy actually holds up when volatility spikes. The goal is the same for everyone: use your own data to make better decisions, no matter how long you hold a position.
Can’t I Just Use a Spreadsheet?
You sure can, and honestly, a lot of traders start there. It’s a great first step toward building the discipline of tracking your trades. But most people hit a wall with spreadsheets pretty quickly.
With a spreadsheet, you end up being a data entry clerk first and an analyst second. A dedicated journal flips that around, letting you focus completely on finding your edge while the software handles the boring stuff.
Using a spreadsheet means you’re on the hook for every single manual entry, building and debugging formulas, and then trying to create charts that actually tell you something useful. It’s a ton of friction, and that’s usually why the habit doesn’t stick. Good software automates all that, pulling in your trades and calculating the important metrics for you, so you can get to the insights faster.
How Quickly Will I See Results?
You’ll probably spot your most glaring, repetitive mistakes within the first couple of weeks. It’s often the simple stuff, like realizing you lose money almost every Friday or that you have a bad habit of revenge trading after a big win. Those patterns tend to jump out right away.
But building real, lasting improvement is a marathon, not a sprint. The deep, meaningful changes come after a few months of consistent journaling, tagging your setups, and doing a weekly review. The software gives you the data almost instantly, but turning those insights into disciplined habits takes a little patience. It’s worth it, though.
Is My Trading Data Secure?
This is a big one, and it’s non-negotiable. Your trading history is sensitive stuff, and any serious platform has to treat it that way. Reputable journal software like TradeReview uses industry-standard encryption to protect your data, both when it’s moving to their servers and when it’s stored.
Before you commit to any tool, make sure they are upfront and clear about their security practices. You need that peace of mind so you can focus on what matters — analyzing your trades and becoming a better trader.
Ready to stop guessing and start analyzing? TradeReview gives you a powerful, intuitive, and secure platform to help you find your edge. Sign up for free and finally see what your data has been trying to tell you.