
At its core, a trading journal entry is about documenting the what and the why of every single trade. This means recording the hard data — like your entry price, exit price, and position size — but also capturing the qualitative information: your rationale for taking the trade, your emotional state, and what you learned after the fact. We’ve all been there, struggling to understand why a strategy works one day and fails the next. It’s this combination of data and honest reflection that creates a complete picture you can actually learn from, helping you build long-term consistency.
Why Consistent Journaling Is Your Secret Weapon

Before we get into the nitty-gritty of how to make an entry, let’s talk about why it’s so critical. Many traders see journaling as a chore, just another tedious task at the end of a long day. But experienced traders know it’s one of the most important tools for survival and growth. Promising guaranteed profits is unrealistic; the real goal is to develop an edge through discipline and analysis.
Think of your journal less like a diary and more like a flight recorder for your trading career. It’s the raw, unfiltered data of every decision, emotion, and outcome. It’s the “black box” that tells you exactly what went right and what went horribly wrong, providing the evidence you need to improve.
Build Discipline and Emotional Control
The market is an emotional battlefield. Greed, fear, and impatience can wreck even the most solid trading plan. Your journal is the first line of defense against these self-sabotaging impulses.
Just by committing to log every trade, you build a powerful system of accountability. This simple habit helps you develop the discipline to shut down common emotional blunders, such as:
- Revenge Trading: Jumping right back into the market after a loss to try and “win your money back.”
- FOMO (Fear of Missing Out): Chasing a trade that has already made its big move, often leading to a poor entry price.
- Impulsive Entries: Taking a trade with no clear setup or reason, just because you feel like you should be in the market.
A journal forces you to confront your actions. When you know you’ll have to write down “entered because of FOMO,” you’re far less likely to make that trade in the first place. It’s a powerful, self-correcting feedback loop.
Shift from Guesswork to Data-Driven Decisions
Ultimately, journaling is what transforms you from a gambler into a data-driven strategist. It gives you the hard evidence you need to find your unique edge in the market. This isn’t just busywork; it’s about creating a personalized playbook that reveals the hidden patterns in your own performance.
Your journal helps you answer the tough questions that are impossible to solve from memory alone. You can pinpoint which strategies perform best under certain market conditions or discover that you consistently give back profits on Friday afternoons. This is how you stop guessing and start making calculated improvements backed by your own data.
The Anatomy of a High-Impact Journal Entry
A great journal entry is more than just a list of numbers; it’s the full story behind a trade. To really understand your performance, you have to capture both the hard data and the messy, human context that goes along with it.
Moving beyond simple entry and exit prices is what transforms a basic log into a powerful analytical tool. It’s how you start to see the hidden patterns that truly define your trading.
This isn’t about creating busy work. It’s about being intentional and capturing the right details efficiently, even when the market is chaotic. The goal is a robust template that’s deep enough for a proper review but simple enough that you’ll actually stick with it long-term.
The Quantitative Data: What Happened
First things first, let’s lock down the objective facts of your trade. These are the non-negotiable numbers that form the foundation of all your performance metrics. If these are wrong, your analysis will be flawed.
This is the bare minimum you need for every single trade. It tells you what happened, creating the factual skeleton of your trade history.
To make this crystal clear, here are the essential fields you absolutely must record for every trade. Think of this table as your foundational checklist.
Essential Fields for Every Trading Journal Entry
| Field | What to Record | Why It’s Critical |
|---|---|---|
| Asset/Ticker | The specific instrument you traded (e.g., AAPL, TSLA, EUR/USD). | Tracks performance across different assets to find what you trade best. |
| Entry & Exit Prices | The exact price you bought and sold at, for each leg of the trade. | The core of all Profit & Loss (P&L) and risk/reward calculations. Accuracy is everything. |
| Position Size | The number of shares, contracts, or lots traded. | Essential for calculating risk, P&L, and understanding your exposure. |
| Date & Time | The timestamp for both your entry and your exit. | Helps you analyze performance based on time of day or market session. |
| Profit/Loss (P&L) | The final outcome in dollars, ticks, and as a percentage of your account. | The ultimate measure of a trade’s outcome, but not necessarily its quality. |
Getting these data points logged accurately is the first, most crucial step. Without them, you’re just guessing.
The Qualitative Story: Why It Happened
This is where the real learning happens. The numbers tell you if you made or lost money, but your notes tell you why. We’ve all had winning trades that were executed with terrible discipline, just as we’ve had perfectly executed trades that ended up as losers.
Understanding the difference is what separates amateurs from professionals.
A journal entry without your thoughts is just a broker statement. It’s the context, the rationale, and the emotional honesty that create real value and lead to breakthroughs in your performance.
Your qualitative notes need to capture the complete “story” of the trade, from start to finish.
Before the Trade: Your Rationale
This is your hypothesis. What did you see in the market that made you believe this was a high-probability opportunity? Documenting your reasoning before you click the button is the best way to make sure you’re sticking to your plan.
Ask yourself:
- What was my exact setup? Was it a technical pattern like a flag, a fundamental catalyst, or a specific indicator crossover? Be precise.
- Why did I take this specific trade? Write down your thesis. For example, “I went long because the stock broke above a key resistance level on high volume, confirming a breakout.”
- What was my plan? Define your profit target and your stop-loss before you enter. No exceptions.
During the Trade: Your Emotions
Let’s be real: the market is designed to test your discipline. Acknowledging your feelings during a trade isn’t a sign of weakness — it’s a sign of self-awareness. It’s how you spot the psychological patterns that are secretly costing you money.
Were you feeling:
- Anxious? Did your stomach drop when the trade moved against you?
- Greedy? Did you get tempted to move your profit target further away just because the trade was working?
- Fearful? Did you exit a good trade at the first hint of a pullback, leaving money on the table?
Being brutally honest here is tough, but it’s the only way to master your trading psychology. For a structured way to start, you might find some good ideas in our guide on building a trading journal template. It can provide a solid framework for capturing both the hard data and these crucial mental notes.
After the Trade: Your Review
Once the trade is closed and the dust has settled, it’s time for objective reflection. Did you follow your plan? What did you learn? This post-trade analysis is where you grade your execution, not just the outcome.
Review these key points:
- Execution Quality: How well did you stick to your predefined entry, stop-loss, and profit targets?
- What Went Right? Did you patiently wait for your setup? Did you manage risk perfectly?
- What Went Wrong? Did you hesitate on the entry? Did you chase the price?
- One Key Takeaway: What is the single most important lesson from this trade that you can apply tomorrow?
Real-World Examples of Winning Journal Entries
Theory is one thing, but seeing how to create a journal entry in practice makes all the difference. Many traders start with low-effort logs that offer zero real value down the line. We understand the struggle to find the time and energy, but a little extra detail goes a long way.
Let’s walk through the evolution of a single trade entry — from poor to great — to show you how adding layers of detail creates a goldmine of actionable information.
The Poor Entry: Just the Basics
This is a common starting point. It’s better than nothing, but just barely.
- Trade: Long 100 shares of NVDA
- P&L: +$150
- Notes: Nice win.
This entry tells you almost nothing. You know you made money, but you have no clue why, how, or if you could ever repeat it. It’s impossible to learn from this.
The Good Entry: Adding Some Context
Okay, now we’re getting somewhere. This version adds the critical quantitative data and a basic rationale for taking the trade.
- Asset: NVDA
- Size: 100 shares
- Entry: $120.50
- Exit: $122.00
- P&L: +$150
- Rationale: NVDA was in a strong uptrend and formed a bull flag on the 5-minute chart. Entered on the breakout above the flag.
- Plan: Stop-loss at $120.00, target at $122.00.
This is a huge improvement. You now have a defined setup and a clear plan, which allows for some basic performance tracking. But it’s still missing the most important element: you.
The Great Entry: Blending Data and Psychology
The best journal entry captures the full story. It integrates the hard data with your thoughts, feelings, and a critical post-trade review. This is where real growth happens.
A great journal entry isn’t just a record of what the stock did; it’s a record of what you did. It separates the trade’s outcome from your execution, which is the only thing you can control.
Let’s look at that same trade one last time, but with the detail that actually matters.
- Asset: NVDA
- Date & Time: June 10, 2024, 10:15 AM ET
- Setup: 5-minute bull flag breakout in a strong uptrend. Confluence with the VWAP (Volume-Weighted Average Price, an indicator showing the average price a security has traded at throughout the day, based on both price and volume) acting as support.
- Entry: $120.50 (100 shares)
- Initial Plan: Stop-loss at $120.00 (below the flag). Profit target at $122.00 (previous day’s high).
- Emotions During Trade: I felt confident at entry because the setup matched my plan perfectly. Got a little anxious when it dipped to $120.75, but I trusted my stop and didn’t panic.
- Exit: $122.00
- P&L: +$150
- Post-Trade Review: My execution was excellent. I identified a high-probability setup, defined my risk, and followed my plan exactly. The anxiety during the dip is a good reminder to trust my analysis.
This infographic breaks down the essential components of a great entry into three core parts: the setup, your feelings, and the final result.
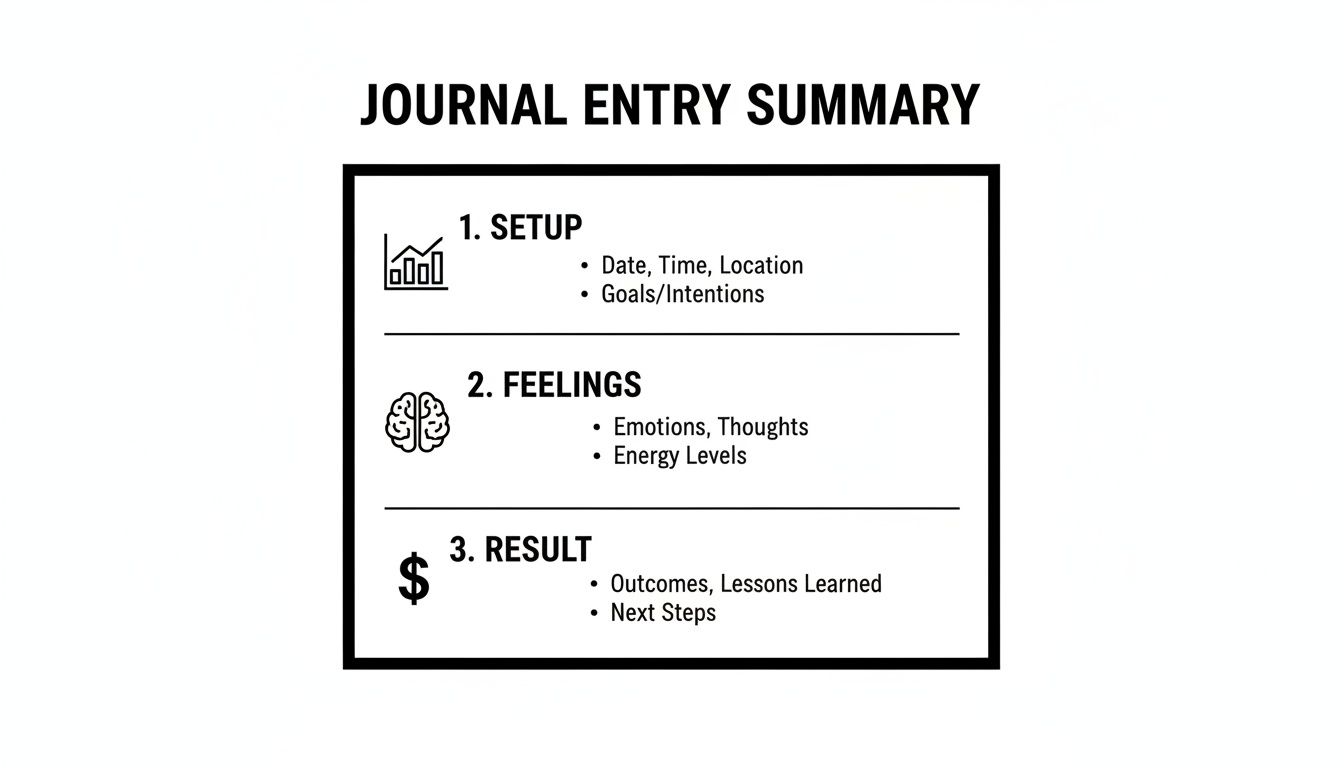
This structure ensures you capture both the market’s action and your reaction, which is the key to long-term improvement. For more inspiration, check out our collection of detailed trading journal examples that show how different traders document their process.
The “great” entry transforms a simple win into a repeatable process, solidifying your edge one trade at a time.
Unlock Deeper Insights with Smart Tagging
A journal crammed with hundreds of trades is really just a pile of data. The magic happens when you organize that data so you can actually filter, sort, and pull real insights from it. This is where a smart tagging system turns your simple log into a powerful performance database.
When you start applying consistent tags to each trade, you move beyond just looking at one-off wins and losses. You start seeing the bigger picture — the patterns in your trading. This simple habit is one of the most important things you can do to truly understand your edge.
Why Tagging Is a Game Changer
So, what is tagging? It’s simply the process of labeling each journal entry with specific keywords that describe the trade. Think of it like creating folders for your data. This lets you group similar trades together and get answers to your most important questions with just a few clicks.
Instead of guessing, you can get definitive answers to questions like:
- Which of my trading setups is actually the most profitable?
- Do I perform better when the market is choppy or when it’s trending hard?
- Am I more likely to make mistakes on Mondays or Fridays?
- Do my FOMO-driven entries consistently cost me money?
This simple act of categorizing your trades gives you the structure you need for deep analysis. It helps you double down on what’s working and cut out what isn’t.
Tagging transforms your journal from a simple diary into a searchable, analytical tool. It’s the bridge between just recording data and actually using it to make smarter trading decisions.
Practical Tagging Methods to Adopt
The key to a good tagging system is consistency. You don’t need dozens of tags for every single trade, but you do need a clear framework that covers the most important aspects of your performance.
I recommend starting with tags for these three core areas:
-
Trading Setups: Label the specific strategy you used for the trade. You might use tags like #Breakout, #MeanReversion, #EarningsPlay, or #TrendContinuation. This is how you’ll figure out which strategies are your real money-makers.
-
Market Conditions: Make a note of the broader market environment. Was it a wild, volatile day or a slow, grinding one? Tags like #HighVolatility, #RangingMarket, or #StrongTrend can reveal if your strategies are better suited for specific conditions.
-
Psychological State: Get honest about your mindset. Were you feeling confident or were you chasing the market? Use tags like #FOMOEntry, #ConfidentExit, #RevengeTrade, or #Disciplined to track how your emotions are really impacting your P&L.
This kind of disciplined approach can yield powerful results. While individual results vary, disciplined journaling is a common practice among successful traders. This focus on data-driven improvement is a significant factor in the growing market for journaling software, as detailed in research from Technavio.
By thoughtfully applying tags, you learn how to make a journal entry that does more than just record history — it actively shapes your future success.
Streamline Your Process with Automation Tools
Let’s be honest — the biggest hurdle to keeping a consistent journal is the manual work. After a long, mentally taxing day in the markets, the last thing anyone feels like doing is spending an hour punching in trade details. This is the exact point where most traders give up on journaling. It’s not a lack of belief in its value; it’s that the process can feel too tedious to maintain over the long run.
Thankfully, modern journaling tools can all but eliminate this problem. Features like automatic broker synchronization are built to pull trade data directly from your brokerage account right into your journal. This doesn’t just save you from hours of mind-numbing data entry; it also sidesteps the costly human errors that can sneak into spreadsheets.
From Raw Data to Actionable Insights
Once your trades are automatically imported, the real work — the analysis — can begin. Automation isn’t just about saving time. It’s about powering the kind of deep analysis that’s nearly impossible to do by hand. All that clean, accurate data feeds directly into powerful dashboards, turning your raw trade history into a visual story of your performance.
This is how you bridge the gap between just logging trades and actually using that information to make smarter decisions tomorrow.
Automation turns your journal from a historical record into a forward-looking decision-making tool. It handles the “what” so you can focus entirely on the “why.”
Visualizing Your Trading Patterns
Instead of getting lost in a sea of numbers, automated tools present your data in simple, visual formats. This helps your brain recognize patterns and trends much more quickly.
- Visual Trade Calendars: See your performance laid out on a calendar to spot patterns instantly. Are you consistently losing money on Fridays? Do you perform better in the morning or afternoon? A calendar view makes these tendencies jump right out at you.
- Performance Dashboards: Keep an eye on your most important metrics in real-time. Key stats like your win rate, profit factor, and average win/loss are all calculated for you, giving you an objective look at your progress without emotional bias.
- The Equity Curve: This is one of the most powerful visuals you have. Your equity curve graphs your account balance over time, giving you an unfiltered look at your consistency. A smooth, upward-sloping curve suggests a healthy strategy, while a volatile, jagged one is a clear sign that something needs fixing.
Ultimately, learning how to make a journal entry is about building a sustainable habit, and automation is key. For a deeper dive, check out our guide on the benefits of auto-importing your trades. It’s the smartest way to get all the benefits of journaling without the burnout.
Common Roadblocks When You Start Journaling
As you get into the rhythm of journaling, you’re going to hit some snags. That’s perfectly normal. We’ve all been there. The trick is to anticipate these common challenges so you don’t lose momentum.
How Many Trades Should I Be Logging a Day?
This is a classic question, but it’s looking at the problem from the wrong angle. The goal isn’t to hit a certain number of entries per day. The goal is 100% consistency.
You need to log every single trade you take. No exceptions. It doesn’t matter if you placed one masterful trade or twenty impulsive ones. Each one is a piece of the puzzle.
Many traders fall into the trap of only logging their winners. They’re too embarrassed or frustrated to face the losses. This is a critical mistake. It creates a completely distorted picture of your trading and renders your journal useless. Focus on the habit, not the count.
What’s the Single Biggest Mistake New Journalers Make?
Hands down, the biggest mistake is focusing only on the numbers — entry, exit, P&L — and ignoring the why. A journal that’s just a list of numbers is no better than your brokerage statement. It tells you what happened, but it gives you zero clues as to why it happened.
Your real breakthroughs live in the qualitative data. It’s the notes on your rationale, your emotional state, and what you were thinking after the trade that expose the patterns you need to fix. This is how you spot things like taking trades out of boredom or closing winners too soon because of fear.
How Quickly Do I Need to Write My Entry After a Trade?
For the hard data, it’s best to do it immediately. As soon as a trade is closed, log the entry price, exit price, and size. This information is fresh in your mind, and you want it to be accurate.
However, for the more reflective parts — your rationale, your emotions — it’s often better to wait until the end of the day. Stepping away for a few hours creates some emotional distance. It lets you look back on your decisions more objectively, without the sting of a loss or the rush of a win clouding your judgment.
Is a Spreadsheet Good Enough to Start?
A spreadsheet is better than nothing, but it’s a limited tool for this job. You’re opening yourself up to manual data entry errors, there’s no way to automatically sync with your broker, and you have to be skilled with formulas to get even basic analysis done.
Modern journaling software is built to save you time and dig up deeper insights automatically. Tools like visual equity curves and performance dashboards do the heavy lifting for you. This frees you up to focus on what actually matters: analyzing your behavior and improving your strategy.
Ready to stop guessing and start building a real, data-driven edge? TradeReview makes it simple to log every trade, find your hidden patterns, and sharpen your performance.
Sign up for your free account today and see what your data is trying to tell you.


