
Before we dive into the weeds of advanced trading metrics, let’s get back to basics. Every single trade you make — whether it’s a home run or a strikeout — boils down to one simple question: did you make money or lose money? The Profit or Loss (P&L) formula is how you find the answer.
The core calculation is straightforward: you subtract the price you paid from the price you sold at, then multiply that by how much you traded.
P&L = (Selling Price – Buying Price) × Quantity
This simple equation is the bedrock of performance tracking. It’s the starting point for figuring out what’s working, what isn’t, and how you can improve your trading over the long term.
The Core Formula for Profit or Loss Explained
It’s easy for new traders to get mesmerized by complex charts and fancy indicators, but they often forget that all those tools are just means to an end. The real story of your trade is told by its P&L. It’s the final score.
We’ve all felt the rush of a winning trade and the gut punch of a loser. It’s part of the journey. But feelings can lie. The P&L formula is your source of truth — it gives you a cold, hard number that cuts through the emotional noise and shows you the actual outcome of your decisions.
Calculating Absolute and Percentage P&L
To really understand how a trade performed, you need to look at it from two different angles: the absolute dollar amount and the percentage return.
The absolute P&L is the raw cash you gained or lost. The percentage P&L puts that number in perspective by showing you how it relates to your initial investment. Both are critical for developing a professional mindset.
Let’s run through a practical example.
Imagine you buy 100 shares of XYZ Corp at $50 a share. A few weeks go by, the stock climbs, and you decide to sell all your shares at $55.
- Buying Price: $50
- Selling Price: $55
- Quantity: 100 shares
Plugging these numbers into our core formula, we get the absolute profit:
Absolute Profit: ($55 Selling Price – $50 Buying Price) × 100 Shares = $500
That $500 is your gross profit. It feels good, but to understand how well your capital worked for you, you need to calculate the percentage return.
First, figure out your total cost to enter the trade:
- Total Initial Cost: $50 per share × 100 shares = $5,000
Now, divide your profit by that initial cost:
- Percentage Profit: ($500 Profit / $5,000 Initial Cost) × 100 = 10%
That 10% figure is incredibly useful. It lets you compare the performance of this trade against others, regardless of the capital risked. A 10% win on a $1,000 trade is just as efficient as a 10% win on a $100,000 trade.
Understanding both the absolute and percentage P&L is the first step toward building a data-driven, long-term trading process. Of course, this is just the gross P&L. In the real world, costs like commissions and fees will chip away at that number, which we’ll cover next.
Core P&L Formulas at a Glance
To make things even clearer, here’s a quick-reference table summarizing the two fundamental P&L calculations we just covered.
| Calculation Type | Formula | Example (100 Shares Bought at $10, Sold at $12) |
|---|---|---|
| Absolute P&L | (Selling Price – Buying Price) × Quantity | ($12 – $10) × 100 = $200 Profit |
| Percentage P&L | (Absolute P&L / Initial Cost) × 100 | ($200 / $1,000) × 100 = 20% Profit |
Keep these two formulas handy. They are the essential building blocks for measuring every trade you take and form the foundation of any serious performance analysis.
Accounting for Real-World Trading Costs
Ever close a trade that looked like a winner on your screen, only to check your account balance and wonder where some of the profit went? It’s a frustrating moment that nearly every trader goes through. The simple P&L formula gives you the gross figure, but the real world is filled with costs that can quietly eat away at your gains.
This is where your Net P&L comes in. It’s the number that truly matters — the profit you actually pocket after all the expenses are paid. Ignoring these costs is like celebrating your salary before taxes are taken out; the final number is often a harsh reality check.
Building the discipline to track every single cost isn’t just good practice; it’s a non-negotiable habit for long-term success. A strategy that looks profitable on paper can quickly become a losing one once you factor in the small, recurring expenses that add up over time.
The Hidden Costs That Impact Your P&L
To get to your Net P&L, you have to subtract three main types of costs from your gross profit or add them to your gross loss. Think of them as the friction of the market.
- Commissions: This is the fee your broker charges for executing a trade. While many brokers now offer “commission-free” trading, this usually only applies to certain assets like stocks and doesn’t always cover options or futures. Always check the fine print.
- Fees: These are smaller charges from exchanges, clearinghouses, or regulatory bodies. Things like SEC fees or transaction fees seem tiny on a per-trade basis, but they can accumulate into a significant amount over hundreds or thousands of trades.
- Slippage: This one is sneaky. Slippage is the difference between the price you expected to get and the price you actually got. It’s common in fast-moving or low-liquidity markets and can turn a small win into a small loss before you even account for other fees. You can dive deeper into this in our guide explaining what slippage is in trading.
Putting It All Together: A Practical Example
Let’s go back to our earlier example of buying 100 shares of XYZ Corp. We calculated a gross profit of $500. Now, let’s inject a dose of reality by adding some typical trading costs.
- Gross Profit: $500
- Commission to Buy: $1.00
- Commission to Sell: $1.00
- Regulatory Fees: $0.25
- Slippage: Let’s say you had $0.02 per share of slippage on your entry and exit combined. For 100 shares, that’s another $2.00 (100 shares x $0.02).
Now, let’s tally up the total costs:
Total Costs = ($1.00 + $1.00) + $0.25 + $2.00 = $4.25
Finally, we can find our true Net P&L:
Net P&L = Gross Profit – Total Costs
Net P&L = $500 – $4.25 = $495.75
In this trade, the costs were pretty minimal. But imagine you’re an active day trader making dozens of trades a day. These small amounts can easily be the difference between a profitable month and a losing one. This is exactly why any real formula for profit or loss must always account for these costs.
How the P&L Formula Works for Different Assets
The basic profit and loss formula is the heart of trading, but its application isn’t one-size-fits-all. Each asset class — stocks, options, forex, futures — has its own unique language and variables. Think of it like cooking: the core principle of applying heat is universal, but you wouldn’t cook a delicate fish the same way you’d sear a thick steak.
The same is true in the markets. The fundamental equation of (Selling Price - Buying Price) × Quantity is just your starting point. To get a true picture of your performance, you have to adjust this formula to fit the specific instrument you’re trading.
This visual shows how your initial gross profit gets whittled down by real-world trading costs to reveal your actual net profit.
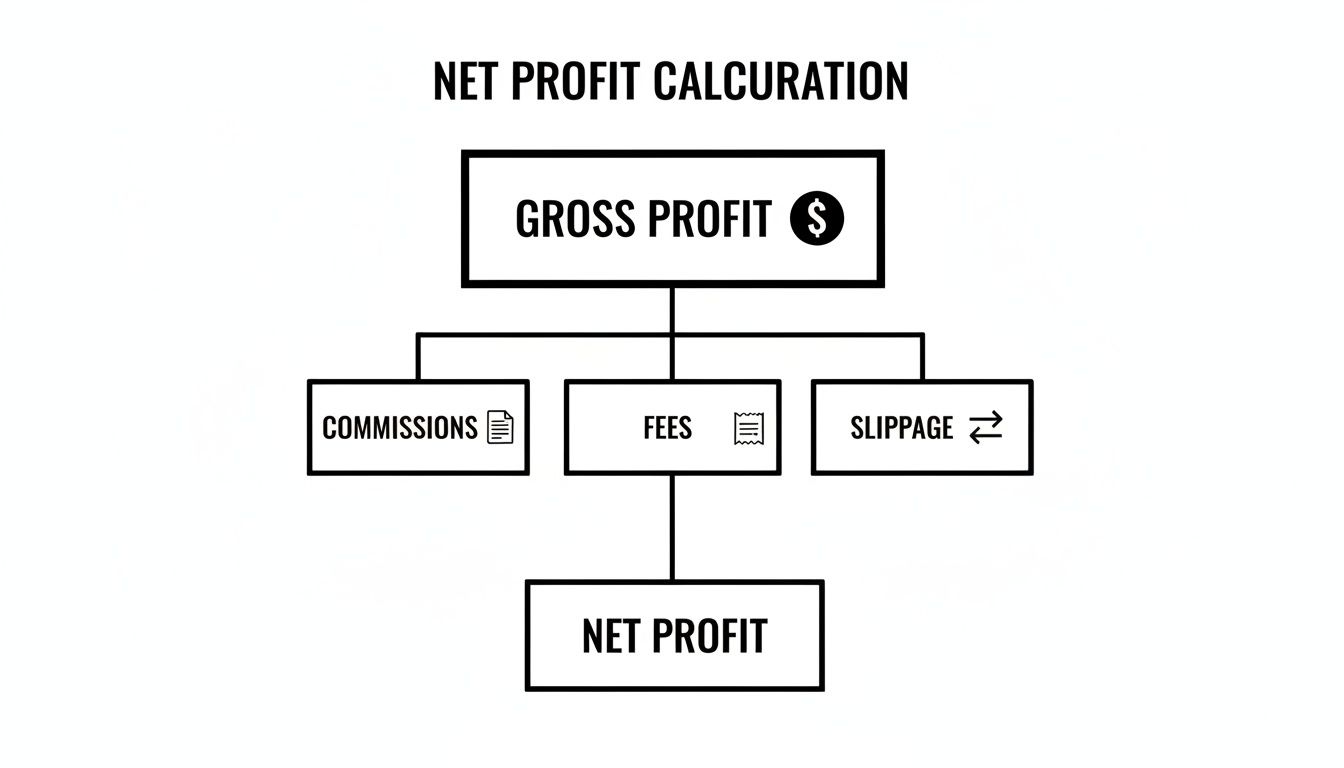
As you can see, your Net Profit is what’s left after you subtract all the necessary evils — commissions, fees, and slippage — from your Gross Profit. Let’s see how this plays out with different instruments.
P&L Calculation by Instrument
The way you calculate P&L can feel different depending on what you’re trading. While the core idea of “sell high, buy low” remains, the mechanics change. The table below breaks down the key variables and simplified formulas for the most common financial instruments.
| Instrument | Key Variables | Simplified P&L Formula Example |
|---|---|---|
| Stocks | Entry Price, Exit Price, Number of Shares | (Exit Price - Entry Price) × Number of Shares |
| Options | Entry Premium, Exit Premium, Multiplier (usually 100), Number of Contracts | (Exit Premium - Entry Premium) × 100 × Number of Contracts |
| Forex | Pips Gained/Lost, Pip Value, Lot Size | Pips Gained × Pip Value × Number of Lots |
| Futures | Points Gained/Lost, Point (or Tick) Value, Number of Contracts | Points Gained × Point Value × Number of Contracts |
Understanding these distinctions is the first step toward accurately tracking your performance and making sense of your trading statements. Let’s dive into a few practical examples.
P&L for Stocks
Calculating profit and loss for stocks is the most straightforward. You’re simply dealing with your entry price, your exit price, and how many shares you traded. It’s a direct application of the basic formula.
- Example: You buy 50 shares of a stock at $100 and later sell them all at $110.
-
Gross Profit:
($110 - $100) × 50 shares = $500.
Just don’t forget to subtract commissions and fees from this number to find your final net profit.
P&L for Options
Options trading adds a couple more layers to the calculation. Instead of a direct share price, you’re working with the premium (the price of the option contract) and a contract multiplier, which is almost always 100 for U.S. stock options.
- Example: You buy one call option contract for a premium of $2.50. The underlying stock moves in your favor, and you sell the same contract for $4.00.
-
Formula:
(Exit Premium - Entry Premium) × Quantity × Multiplier -
Gross Profit:
($4.00 - $2.50) × 1 contract × 100 = $150.
P&L for Forex
In the world of forex, P&L is all about pips. A pip is the smallest price move a currency pair can make. To figure out your profit, you’ll need to know the number of pips you gained or lost, the pip value, and your lot size.
A standard lot is 100,000 units of the base currency. For most USD-quoted pairs, one pip move on a standard lot is worth $10.
- Example: You go long one standard lot of EUR/USD at 1.0750 and sell at 1.0780. That’s a 30-pip gain.
-
Formula:
Pips Gained × Pip Value × Number of Lots -
Gross Profit:
30 pips × $10 × 1 lot = $300.
The brutal simplicity of the P&L formula is universal, but its impact can be amplified dramatically by leverage. The high-stakes world of trading is filled with cautionary tales. One of the most infamous comes from National Australia Bank in 2004, where traders concealed unauthorized foreign exchange trades, accumulating losses of AUD 360 million. When positions are hidden, the numbers can explode into catastrophic losses. You can read more about some of the largest trading losses in history on Wikipedia.
P&L for Futures
Finally, with futures, your P&L hinges on the point value (or tick value) of the specific contract you’re trading. Every futures contract has its own unique specifications, so you must know them beforehand.
For example, the popular E-mini S&P 500 (ES) contract has a point value of $50.
- Example: You buy one ES contract at 4500.00 and sell it at 4510.00, capturing a gain of 10 points.
-
Formula:
Points Gained × Point Value × Number of Contracts -
Gross Profit:
10 points × $50 × 1 contract = $500.
Mastering these specific calculations is crucial. It’s not just about knowing if you won or lost; it’s about accurately tracking your performance, which is the foundation of building discipline and thinking like a professional trader.
Realized vs. Unrealized P&L and Why It Matters
It’s dangerously easy to get caught up in the emotional rollercoaster of a fluctuating open position. Seeing your screen flash green with a growing profit feels incredible, but that money isn’t truly yours until you close the trade. This is the crucial distinction between unrealized P&L and realized P&L.
Think of it like this: an unrealized profit is like owning a rare collectible. On paper, it’s worth a lot, but until you actually sell it and have cash in hand, its value is just potential. And that potential can vanish in an instant if the market turns against you.
Understanding the Difference
Getting a firm grip on this concept is fundamental to building the emotional discipline every successful trader needs.
- Unrealized P&L: This is the “paper” profit or loss on a position that is still open. It’s a theoretical number, changing with every single tick of the market.
- Realized P&L: This is the actual, concrete profit or loss from a trade you have officially closed. The money has been either added to or subtracted from your account balance. It’s done. It’s real.
The psychological trap so many traders fall into is treating unrealized gains as if they’re already in the bank. This emotional attachment can lead to poor decisions, like holding onto a losing trade far too long in the hope it will “come back,” or cutting a winner short out of fear of giving back profits. You can dive deeper into this topic in our guide on what P&L stands for and its importance.
The key to disciplined trading is focusing on your process, not the fluctuating unrealized P&L. Your only job is to execute your plan. The realized profits and losses are simply the outcome of that execution.
The Real-World Consequences
Ignoring this difference can have massive consequences. Just look at Procter & Gamble’s infamous 1994 derivatives disaster. The company lost a staggering $157 million on interest rate swaps when the Federal Reserve made an unexpected move, turning what they thought was a hedged position into a massive liability.
This shows how even corporate giants can get burned when potential losses become very real ones.
For individual traders using a journal like TradeReview, the lesson is crystal clear. By focusing only on your realized P&L, you can analyze your actual performance, calculate your profit factor, and make data-driven adjustments to your strategy. This disciplined approach stops you from being swayed by the temporary illusion of paper profits and keeps your eyes on what truly matters — your long-term bottom line.
Turning Your P&L Data into Actionable Insights

Knowing the profit or loss on a single trade is just the beginning. The real magic happens when you start looking at what your collective P&L data says about your entire trading strategy. This is the moment you stop being a scorekeeper and start thinking like a strategist.
A trading journal is the bridge connecting that raw data to genuine insight. By systematically logging every trade, you build a rich dataset that lets you move beyond gut feelings and make decisions backed by hard evidence. It’s the one habit that separates traders who learn from their mistakes from those who just keep repeating them.
Key Metrics to Analyze in Your Journal
Once you start logging your trades, you can unlock performance metrics that reveal the true health of your strategy. These numbers tell a story that a single P&L figure never could.
- Win Rate: This is simply the percentage of your trades that end up profitable. While a high win rate feels great, it doesn’t guarantee you’re making money if your losses are significantly larger than your wins.
- Average Win vs. Average Loss (Risk/Reward Ratio): This metric is crucial. It compares the average dollar amount of your winning trades to your losing ones. A healthy strategy almost always has winners that are substantially bigger than its losers.
- Profit Factor: You calculate this by dividing your total gross profit by your total gross loss. A profit factor above 1.0 means your strategy is profitable. Most serious traders aim for 1.5 or higher as a sign of a truly robust system.
These metrics, all derived from a simple formula for profit or loss, transform your trading from a series of one-off bets into a measurable business. For a deeper dive, check out our guide on how to conduct a thorough profit and loss analysis.
Visualizing Your Performance with an Equity Curve
One of the most powerful tools in a trader’s arsenal is an equity curve. It’s a simple chart that plots your account’s P&L over time, giving you an immediate, intuitive picture of your performance.
A steadily rising equity curve shows you’re on the right track. But if it’s choppy, volatile, or heading downward, it’s a clear signal that something needs to be fixed. This kind of visual feedback is invaluable for staying disciplined and making adjustments before small problems spiral out of control.
The importance of diligent P&L tracking cannot be overstated. The collapse of Barings Bank in 1995 remains a chilling case study. A single trader managed to rack up £827 million in losses by hiding them in a secret “error account” — a catastrophic failure of oversight that a transparent, properly kept journal would have exposed instantly.
This historical disaster is a stark reminder for every trader, big or small. Using a modern dashboard for instant P&L visibility and syncing it with your broker to catch any discrepancies isn’t just a convenience — it’s a critical part of managing your risk. With automated tools, you can put your energy into analysis and strategy, confident that your numbers are accurate and your performance is crystal clear.
Common Questions About Calculating Trading P&L
Even after you nail down the basics, you’ll run into specific scenarios that can make calculating P&L a little tricky. We see the same questions pop up all the time from traders who are serious about building discipline and improving their process.
Let’s clear up a few of the most common sticking points. We’ve all been there — staring at a trading statement, trying to make the numbers match what we thought happened. Getting these concepts down will help you apply the formula for profit or loss with total confidence.
How Do I Calculate P&L for a Short Sale?
Figuring out the profit on a short sale is just like a regular long trade, but you flip the order of operations. You’re selling first and buying back later, hoping the price goes down. The formula is simply reversed.
Short Sale P&L = (Entry Price – Exit Price) × Quantity – Costs
Let’s say you short 100 shares of a stock at $50 and cover your position by buying them back at $45. Your gross profit would be ($50 - $45) × 100 = $500. With a short, your goal is for the exit price (your buy-back) to be lower than your entry price.
What if I Only Partially Close a Position?
This happens all the time. If you don’t sell all your shares or contracts at once, you only “realize” the P&L on the part of the position you closed. The rest of your position is still open, and its profit or loss is still unrealized.
Imagine you bought 200 shares at $20. The stock climbs to $25, and you decide to sell 100 shares to lock in some profit.
-
Realized P&L: You’ve locked in the gain on the shares you sold:
($25 - $20) × 100 shares = $500. That $500 is now officially in your account balance (minus any costs). - Unrealized P&L: You’re still holding the other 100 shares. Their P&L will keep changing with the market price until you finally decide to close the rest of the position.
How Does the P&L Formula Handle Dividends?
Dividends can definitely boost your total return, but they’re usually treated separately from a trade’s capital gain or loss. If you hold a stock on its ex-dividend date, the dividend payment you receive becomes part of your overall profit from that investment.
For tax purposes, though, dividends and capital gains are often in different buckets. Knowing how different financial events are categorized is critical. As the IRS notes, this becomes especially important when dealing with complex situations, such as seeking deductions for losses from investment scams. You can dig deeper into official guidance on the IRS Taxpayer Advocate Service website.
Most modern trading journals, including TradeReview, let you log events like dividends separately. This keeps your records clean for both performance analysis and tax reporting.
Stop letting valuable insights slip through the cracks. TradeReview automates your P&L tracking, syncs with your broker, and transforms raw data into a clear roadmap for improvement. Ditch the manual spreadsheets and start making data-driven decisions today. Get started for free at tradereview.app.


