On the surface, calculating trading profit seems simple: subtract what you paid from what you sold it for. But as any trader who’s been through the ups and downs of the market knows, that’s just the beginning. The real calculation, the one that truly matters, is: (Sale Price – Purchase Price) – (Commissions + Fees) = Net Profit.
Forgetting that second part is a common trap, especially when you’re starting out. It can give you a dangerously skewed picture of your actual performance and lead to poor decisions down the road.
The Real Story Behind Your Trading P&L

Let’s be honest — trading is tough. It’s far too easy to get swept up in the adrenaline of a big win, but lasting success isn’t built on excitement. It’s built on a disciplined system for understanding the real numbers behind every single trade. It’s a journey that requires patience and a long-term perspective.
This all starts with a critical distinction that trips up countless traders: gross profit versus net profit.
Gross profit is just the simple difference between your entry and exit price. It’s a vanity metric. It feels great, but it doesn’t pay the bills. Net profit is the only number that truly matters — it’s the cash that actually hits your account after every single cost is stripped away.
Why Every Penny Counts
Overlooking the small stuff is one of the quickest ways to misunderstand your performance and, ultimately, make terrible decisions. A seemingly tiny commission here or a few cents of slippage there might not feel like much on a single trade. But over hundreds or thousands of trades? It adds up to a massive drain on your bottom line.
This isn’t just about bookkeeping; it’s about survival and building a sustainable trading career.
To get an accurate picture, you have to track every component that eats into your potential gains.
Many traders just focus on the commission their broker charges, but the real cost of a trade is often much more complex. To truly understand your profitability, you need to account for everything that happens from the moment you hit “buy” to the moment you “sell.”
Here’s a breakdown of the key components you absolutely must track.
Key Components of Net Trading Profit
| Component | Description | Practical Example |
|---|---|---|
| Commissions & Fees | The direct costs your broker charges for executing trades. | A $5 commission on a $50 profit immediately reduces your gain by 10%. |
| Spreads | The difference between the buy (ask) and sell (bid) price. This is an embedded cost on every trade. | In forex, the EUR/USD spread might be 1 pip. On a standard lot, that’s a $10 cost you pay just to enter the trade. |
| Slippage | When your order fills at a price different from what you expected, often during high volatility. | You try to buy a stock at $10.00, but the market moves fast and your order fills at $10.02. That’s a $0.02 per share hidden cost. |
| Financing Costs | Also known as swap or overnight fees for holding leveraged positions. | Holding a leveraged CFD position for weeks can rack up significant fees that eat into long-term profits, sometimes even turning a gross profit into a net loss. |
Failing to account for these costs is like flying blind. You end up making strategic decisions based on incomplete and misleading data, which is a recipe for disaster.
Understanding these hidden costs is the first real step toward accountability. A trader who ignores fees is just guessing. True discipline starts with honest, ruthless accounting of every single penny.
The Core Formulas for Profit and Loss
At the end of the day, figuring out your trading profit comes down to some simple math. Getting a firm grip on these basic formulas is one of the most important things you can do to trade with discipline, taking the emotion and guesswork out of your performance review.
For a standard “long” trade — where you buy something hoping the price goes up — the math is straightforward:
(Sale Price per Share – Purchase Price per Share) * Number of Shares – Total Fees = Net Profit
If you’re going “short” — betting on the price to drop — you just flip the numbers around:
(Entry Price per Share – Exit Price per Share) * Number of Shares – Total Fees = Net Profit
See how Total Fees always get subtracted? This relentless focus on net profit is what really separates the consistently profitable traders from everyone else.
Putting the Formulas into Practice
Let’s walk through a realistic example with a stock trade.
Imagine you buy 100 shares of a tech company at $150 per share. A few weeks later, you sell them all for $165 per share. Let’s say your broker charged a $5 commission to get in and another $5 to get out.
Here’s the breakdown:
- Gross Profit: ($165 – $150) * 100 shares = $1,500
- Total Fees: $5 (buy) + $5 (sell) = $10
- Net Profit: $1,500 – $10 = $1,490
This isn’t just for stocks; the logic is the same everywhere. Say you buy the EUR/USD forex pair at 1.0750 and sell it at 1.0800. That’s a 50-pip move. On a standard lot (100,000 units), that looks like a $500 gross profit. But after you subtract your broker’s spread (let’s say 1 pip, or $10) and any commissions, your actual net gain is closer to $490. It’s a small difference, but it adds up over time.
The formula never changes, whether you’re trading stocks, crypto, or forex. The variables shift — different prices, fees, and position sizes — but the fundamental math for calculating your profit stays exactly the same.
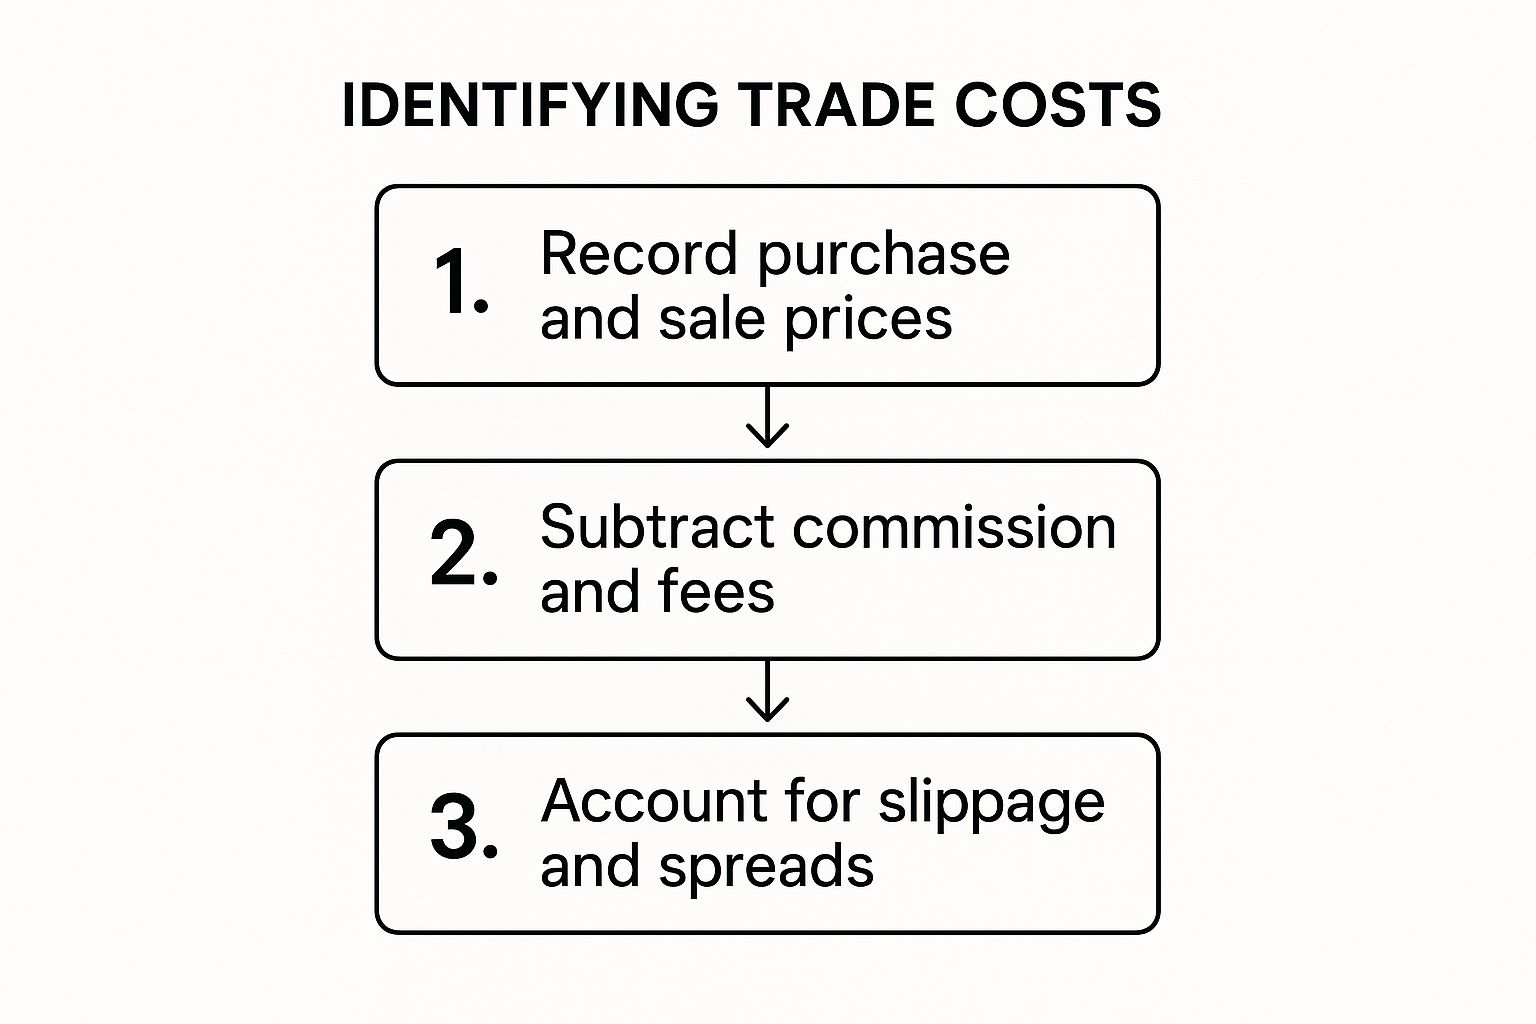
This is why it’s so critical to identify every single cost tied to your trades.

As you can see, calculating your real profit isn’t just about the entry and exit price. It’s about a complete and honest accounting of every single cost that chipped away at your gross returns.
Uncovering the Hidden Costs That Eat Your Returns

That gross profit figure on a winning trade feels great, but it can be a mirage. The only number that really matters is your net profit — the actual cash that lands in your account. This is where so many traders get a harsh reality check, and it’s a struggle we all face.
These “invisible” costs are quietly chipping away at your hard-earned gains. They aren’t just minor details; they’re often the deciding factor between a winning and losing strategy over the long run.
The Most Common Profit Killers
Let’s break down the usual suspects that can drain your account if you’re not paying close attention. Ignoring these is a recipe for long-term frustration.
- Broker Commissions: This is the most obvious one — the fee you pay for executing your buy and sell orders.
- The Spread: This is a big one, especially in forex and crypto. It’s the gap between the buy (ask) and sell (bid) price, and you pay this hidden cost on every single trade you make.
- Overnight Financing (Swaps): Holding a leveraged position overnight? Your broker will charge you a fee for it. These can add up surprisingly fast on swing trades.
A seemingly tiny $5 commission per trade doesn’t sound like much, right? But if you make just five trades a day, that balloons to $6,500 in costs over a year. That’s more than enough to turn a profitable year into a significant hole.
Thinking about these costs is absolutely crucial, especially when you factor in your maximum drawdown and overall risk management.
The most disciplined traders are relentless accountants. They know that every commission, every pip of spread, and every swap fee is a direct hit to their bottom line. Success isn’t just about finding good trades; it’s about protecting the capital you already have.
The Bigger Picture: From Single Trades to Overall Performance
That rush from a single profitable trade is fantastic, but it doesn’t build a career. Real, lasting success in trading comes from zooming out and adopting a long-term mindset. You have to look at your entire portfolio’s performance, not just one lucky win.
This is the shift from the emotional high of a single trade to the disciplined analysis of your whole strategy. It’s no longer about whether your last trade was green or red; it’s about what all your trades, together, are telling you.
Metrics That Tell the Real Story
To get that big picture, you need to focus on a few key performance indicators. These numbers cut through the day-to-day noise and show you the true health of your trading system.
- Win Rate: This is simply the percentage of your trades that make money. While a high win rate feels great, it’s pretty useless on its own. Our guide on how to calculate your win rate takes a much deeper look at this.
- Risk-to-Reward Ratio: This one compares how much you stand to lose on a trade versus how much you could potentially gain. A healthy ratio ensures your winners are big enough to more than cover your losers.
- Average Profit vs. Average Loss: This is the bottom line. Are your winning trades meaningfully larger than your losing ones? If not, even a sky-high win rate might not be enough to keep you profitable in the long term.
The most critical insights come when you combine these metrics. A trader with a 70% win rate might feel like they’re crushing it, but if their average loss is five times their average profit, one bad trade can wipe out ten good ones. It’s a classic trap that data-driven analysis helps you sidestep.
The Power of a Meaningful Sample Size
It’s so tempting to judge your strategy after just a handful of trades. Don’t do it. The outcome of any single trade is mostly random noise. We’ve all been there — a string of wins makes you feel invincible, and a string of losses makes you question everything.
Your true performance only starts to show up over a larger sample size — think 20, 50, or even 100 trades. Looking at your results over the long haul builds discipline. It helps you detach from the emotional rollercoaster of individual wins and losses and forces you to focus on whether your strategy has a real statistical edge.
Turning Historical Data into a Strategic Edge

Calculating trading profit is so much more than just bookkeeping. For disciplined traders, it’s the bedrock of their entire strategy. They don’t just react to the market — they run the numbers, analyzing potential profit and risk before ever clicking the buy or sell button.
This is where simple math becomes a powerful decision-making tool.
Instead of just logging what happened in the past, you start using that data to model what could happen next. It’s a fundamental shift in mindset, one that separates traders who get lucky from those who build lasting careers. It all comes down to asking one crucial question: “Based on my analysis, does this trade offer a reward that truly justifies the risk?”
This kind of methodical approach helps manage expectations. Trading isn’t about getting rich overnight; it’s about building a consistent edge over time.
The Importance of a Long-Term View
Think about some of the world’s most respected investors. They don’t make impulsive bets; they build a thesis based on deep analysis, calculate the potential outcomes, and only commit capital when the odds are stacked in their favor. Their success comes from a career of disciplined decisions, not one spectacular trade.
This mindset is accessible to everyone. By focusing on your numbers and maintaining a long-term perspective, you can build the conviction needed to stick with your strategy even when the market is challenging.
Successful trading isn’t about being right every time. It’s about ensuring your wins are strategically larger than your losses over the long haul, a goal achieved through meticulous pre-trade calculation and disciplined analysis.
This kind of strategic thinking is exactly why systematically testing your ideas is so valuable. To really build an edge, you have to understand how to review historical performance by applying your profit calculation rules to past market data.
This process validates your approach before you risk a single dollar of real capital. It turns historical information into a predictive tool and builds the discipline you need for long-term success.
Common Questions About Calculating Trading Profit
When you start digging into the details of calculating trading profits, it’s easy to hit a few roadblocks. Many traders get tripped up on the same points when they move from theory to their own trade journal. That’s perfectly normal, but getting it right is what builds long-term discipline.
Let’s clear up some of the most frequent questions that come up.
What Is the Difference Between Realized and Unrealized Profit?
This is one of the most fundamental concepts in trading, and it directly impacts how you manage your positions. Getting this wrong can lead to some painful mistakes.
- Unrealized Profit: Think of this as “paper profit.” It’s the potential gain on a position you’re still holding. If you bought a stock at $100 and it’s now trading at $110, you have an unrealized profit of $10 per share. It’s not really yours until you close the trade.
- Realized Profit: This is the money you’ve actually locked in. Once you sell that same stock at $110, the $10 per share gain becomes a realized profit. It hits your account’s cash balance, and it’s officially yours.
Here’s the hard truth: unrealized profits can disappear in a flash. Your true success as a trader is measured by the profits you consistently realize, not the ones that just sit on your screen.
Do I Pay Taxes on All Trading Profits?
Taxes are a huge part of your real net profit, but this is where things get tricky. In most places, you only pay capital gains tax on your realized gains.
But the rules can change dramatically depending on where you live and what you’re trading. For example, a crypto-to-crypto trade is often seen as a taxable event (meaning, you realize a gain or loss), even if you never cashed out into dollars. It’s a common trap many new crypto traders fall into.
Don’t assume your trading P&L is the same as your taxable profit. You could have a net loss for the year but still owe a hefty tax bill on individual winning trades you closed out earlier. Always talk to a qualified tax professional to figure out your specific obligations.
Getting this wrong can result in surprise tax bills and penalties you definitely don’t want.
Ready to stop guessing and start analyzing with clarity? TradeReview offers a powerful and intuitive trading journal that automates your performance tracking. With features like broker sync, detailed analytics, and a clear dashboard overview, you can finally get a true picture of your profitability. Sign up for free and start making data-driven decisions today.


