
Let’s be honest. Every single trader has felt that gut-wrenching moment when a perfect setup goes completely sideways. You see the pattern, feel the conviction, and jump in — only to watch the trade immediately turn against you. We’ve all been there, and it’s a painful part of the learning process.
It’s tempting to blame the market, a sudden news event, or just plain bad luck. But what if the real story was right there in your own execution history? This is where understanding what a tradebook is can fundamentally change your trading career.
A tradebook is the official, unchangeable record of every single trade you make. It’s the raw, objective truth of your trading activity — what you bought or sold, the exact price, and the precise time. Think of it as the factual backbone of your entire trading business.
From Hopeful Guesses to Hard Data
Many traders confuse a tradebook with a trading journal, but they serve two very different — yet equally vital — roles. If your trading journal is where you explore the “why” behind a trade (your strategy, mindset, and emotions), your tradebook is the undisputed “what.” It contains only the cold, hard facts.
A tradebook transforms trading from a game of chance into a business of probabilities. It forces you to confront the objective results of your actions, stripping away emotion and narrative to reveal what is truly working.
Without this factual record, you’re just flying blind. You might feel like you’re great at trading breakouts or think you always cut your losses quickly, but feelings aren’t facts. The tradebook provides the pure, unedited data to prove or disprove your assumptions. It’s the first step towards true, long-term discipline.
Why Your Tradebook is Non-Negotiable
A quick comparison can clarify the distinct roles of a tradebook and a trading journal.
Tradebook vs Trading Journal at a Glance
| Aspect | Tradebook | Trading Journal |
|---|---|---|
| Purpose | Records the objective facts of a trade (what, when, how much). | Records the subjective context of a trade (why, how I felt). |
| Content | Execution price, quantity, timestamp, instrument, P&L. | Strategy, setup, emotions, mistakes, lessons learned. |
| Nature | Quantitative and unchangeable. | Qualitative and reflective. |
| Analogy | A company’s official accounting ledger. | A CEO’s daily work diary. |
This distinction is critical for building a sustainable edge in the markets. The tradebook is your single source of truth.
The tradebook acts as the ledger for your trading business. Just as no company can survive without accurate accounting, no trader can achieve consistent results without a precise, factual record of their transactions. It’s not about finding a magic bullet; it’s about building a professional process.
Ready to dive deeper? You can learn more about these crucial differences in our article explaining what a trade journal is and why you need one. It’s the first step toward building the discipline required for a long-lasting trading career.
The Anatomy of a Professional Tradebook
A professional tradebook is so much more than a simple list of wins and losses. It’s a rich, raw dataset where every single column tells a part of your trading story. Understanding these components isn’t just about logging numbers — it’s about seeing the powerful narrative they create when pieced together.
Think of it like a detective investigating a crime scene. Every detail, no matter how tiny, is a potential clue. Overlook one piece of evidence, and you might come to the completely wrong conclusion about what really happened with your strategy.
The Core Data You Must Track
To build that complete picture, your tradebook needs to capture a few non-negotiable data points for every single execution. These aren’t just suggestions; they are the absolute bedrock of any serious performance analysis.
- Timestamp: The exact date and time of the trade. For day traders, this needs to be precise down to the second. It’s how you analyze intraday performance and spot patterns around the market open, the lunch lull, or the closing bell frenzy.
- Security Symbol: The ticker of whatever you traded (e.g., AAPL, SPY, BTCUSD). This is essential for filtering your results and seeing how you perform across different instruments.
- Trade Direction: Was it a Buy (Long) or a Sell (Short)? This simple but crucial field helps you figure out if your strategies are biased toward a particular market direction.
- Volume: The number of shares or contracts you traded. Tracking volume is key to understanding how your position sizing impacts your bottom line. For example, you might discover your biggest losses always happen when you trade an unusually large size.
- Execution Price: The actual price your trade was filled at. This is the unvarnished truth, exposing the real cost of slippage compared to the price you thought you were getting.
The image below breaks down the key differences between the objective data of a tradebook and the subjective insights you’d put in a trading journal.
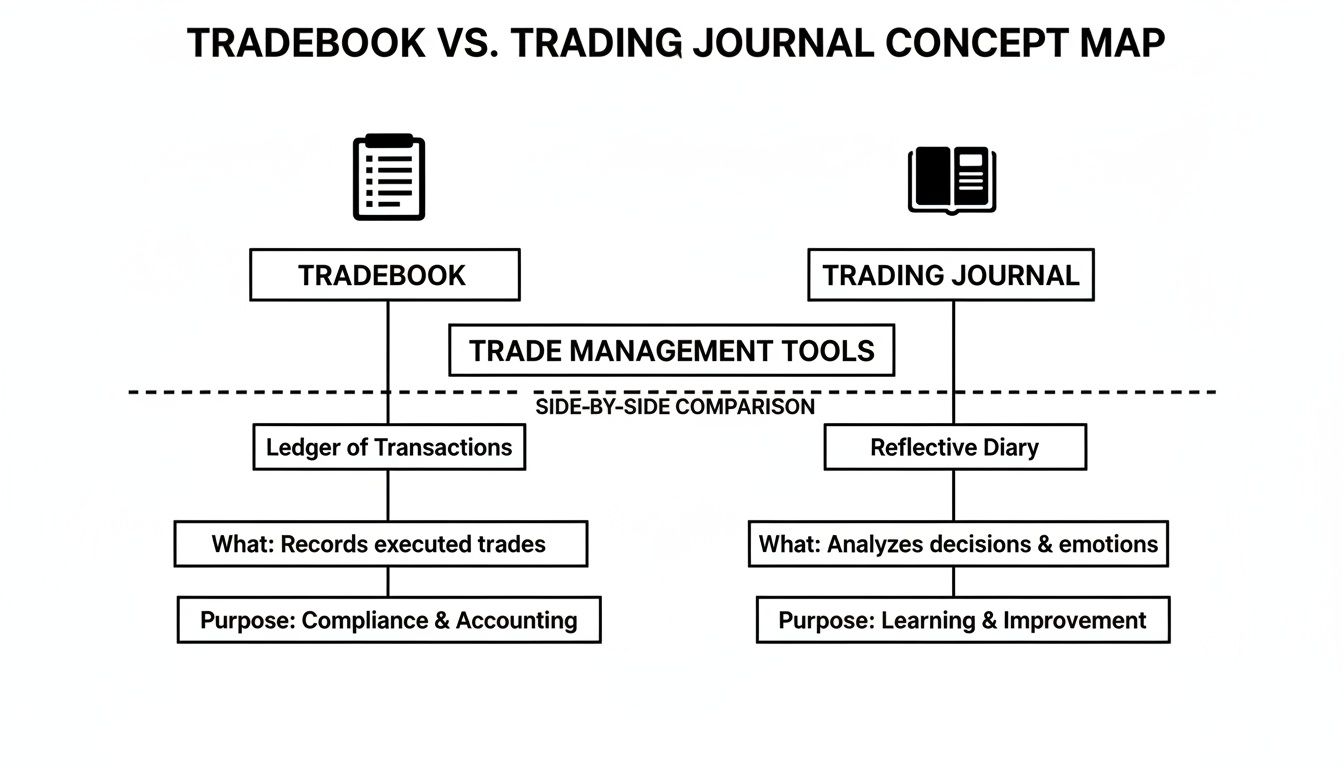
As you can see, the tradebook is the factual ledger, while the journal is where you add the “why” — the strategic and emotional context behind the numbers.
Why Every Detail Matters
It’s easy to dismiss tracking all these details as a chore. We’ve all been there, eager to jump into the next trade instead of documenting the last one. But this is exactly the kind of discipline that separates aspiring traders from consistently profitable ones. It’s a commitment to a long-term process over short-term gratification.
For example, if you consistently see poor execution prices, your tradebook data might reveal that your limit orders are too aggressive or that your platform’s latency is costing you money. The data tells a story you might otherwise miss.
Tracking each data point transforms you from a passenger to the pilot of your trading career. You stop reacting to outcomes and start engineering them based on hard evidence.
This meticulous record-keeping provides the raw material for deep, meaningful analysis. While a basic spreadsheet can get you started, you can learn more about managing these records by building your own trade journal in Excel.
Once you truly appreciate the “why” behind each data point, you’ll start to see your tradebook not as a burden, but as a treasure map leading to better habits and a far more robust strategy.
How Professionals Use Tradebooks to Gain an Edge
For professional traders and financial institutions, a tradebook isn’t just a record — it’s the central nervous system of their entire operation. It goes way beyond a simple list of transactions to become the ultimate source of truth, the bedrock for every critical business decision, risk management protocol, and compliance check. This disciplined, data-first approach is how pros build a sustainable edge.
They understand that feelings come and go, but the data is permanent. A tradebook delivers the unshakeable, objective evidence needed to prove a strategy works, uncover hidden flaws, and stay accountable to their own rules. It’s this deep commitment to hard evidence that separates professional analysis from amateur guesswork.
The professional trader treats their tradebook like a scientist treats a lab notebook. It’s not a place for opinions or hopes; it’s a sterile environment for recording pure, unadulterated data to be tested and validated.
This mindset is universal, scaling from a solo retail trader working from a home office all the way up to the largest hedge funds on Wall Street. The core principles of data integrity and rigorous analysis are the same whether you’re managing a personal account or a billion-dollar portfolio.
From Personal Ledgers to Institutional Risk Management
In the world of professional finance, the concept of a tradebook expands dramatically. In the high-stakes arena of global banking, the trading book is a cornerstone. It represents all the assets a firm holds specifically for active trading, not long-term investing.
Unlike a bank’s loan portfolio, these assets — stocks, bonds, derivatives — are marked-to-market daily. This means their value is updated constantly based on current market prices. This distinction is so crucial that regulators require banks to hold more capital against their trading books to cover the immense short-term price risk. You can learn more about how institutions manage their trading books at Risk.net.
Now, for a retail trader, the stakes might feel smaller, but the applications are just as vital. Your personal tradebook is the foundation for several essential business functions:
- Performance Analytics: It’s where you get the raw data to calculate crucial metrics like your profit factor, average win/loss, and trade expectancy. These numbers give you the unvarnished truth about your strategy’s health, totally free from emotional bias.
- Strategy Backtesting: A clean, accurate tradebook lets you test new ideas against your own history. You can filter by setup, time of day, or market condition to see how a new rule would have actually impacted your past performance.
- Tax Reporting: When tax season rolls around, an organized tradebook is your best friend. It gives you a clear, chronological record of all capital gains and losses, making the reporting process painless and accurate.
Adopting a Professional Mindset
Embracing the tradebook is about more than just logging data. It’s about adopting the disciplined, long-term thinking of a professional. It means truly accepting that you will have losing trades. Your success doesn’t depend on any single outcome, but on consistently executing a strategy that has a positive edge over hundreds of trades.
This can be a tough mental shift. We all struggle with the emotional rollercoaster of wins and losses. It takes patience and the guts to confront your mistakes head-on, right there in the data.
But once you start seeing your tradebook as your most valuable strategic asset, everything changes. You unlock the ability to make small, data-driven improvements that compound over your entire trading career.
Turning Raw Tradebook Data Into Actionable Insights
Having an accurate tradebook is step one, but its real power is unlocked when you start analyzing the data. This is where the magic happens. It’s the moment you stop just recording history and start using it to shape your future as a trader.
This is the process that turns you from a reactive market participant into a proactive business owner. Instead of being surprised by your results, you begin to understand the why behind them. The goal is to zoom out from any single trade and spot the larger, statistically significant patterns that truly define your performance over time.
From Numbers to Narratives
The first layer of analysis is all about calculating core performance metrics. These numbers give you a high-level snapshot of your strategy’s health, cutting straight through the emotional noise of daily market swings. Think of them as the vital signs for your trading business.
Here are a few essential metrics your tradebook data can reveal:
- Win Rate: Simple enough — it’s the percentage of your trades that are profitable. But be careful; this metric can be incredibly misleading on its own. A 90% win rate is useless if the 10% of losing trades wipe out all the gains and more.
- Average Win vs. Average Loss: This ratio compares the average size of your winners to your losers. A healthy ratio (ideally above 1.5:1) ensures your winning trades are big enough to pay for the inevitable losses.
- Profit Factor: You get this by dividing your total gross profits by your total gross losses. Anything above 1.0 means you’re profitable, but many traders aim for 1.75 or higher to confirm they have a robust edge.
These metrics are your first clues. A low win rate might be perfectly fine if it’s paired with a high average win/loss ratio. On the flip side, a high win rate with a poor ratio is a recipe for disaster.
Uncovering Your Hidden Trading Patterns
With these foundational metrics sorted, you can dig deeper to find the hidden habits and tendencies quietly impacting your bottom line. This is where a detailed tradebook becomes an invaluable asset for serious strategy refinement.
A trade book in the stock market acts as the permanent, unchangeable ledger of every executed transaction. The moment an order executes on an exchange like the NYSE or BSE, it moves from the order book to this permanent record. That detailed data — like precise timestamps and execution prices — is the fuel for deep analysis. For more on this, you can learn about the distinction between an order book and a trade book at StockGro.
You can start asking targeted questions like:
- Do I make more money trading in the first hour of the day or the last?
- Is my win rate higher on long trades or short trades?
- Which specific trading setup (e.g., “bull flag,” “mean reversion”) is actually my most profitable?
Answering these specific, data-backed questions is what separates professional, systematic improvement from aimless guessing. It allows you to fix what’s broken and double down on what works.
This deeper review requires discipline. It’s always tempting to skip this step, especially after a tough week. But that’s precisely when the review is most valuable. The insights needed for long-term success aren’t found in a single winning trade; they emerge from the honest, consistent analysis of hundreds of trades over time.
Automating Your Tradebook for Effortless Analysis
Let’s be real — manual data entry is a soul-crushing chore. We’ve all been there. You start a spreadsheet with the best of intentions, but after a few days, logging every single trade becomes tedious, time-consuming, and worst of all, riddled with errors. This friction is exactly why so many traders give up on keeping records, missing out on the goldmine of insights their own performance data holds.
It’s completely understandable. After a long, mentally taxing day in the markets, the last thing you want to do is spend an hour meticulously typing numbers into a spreadsheet. But what if you could skip that step entirely? This is where technology steps in, bridging the gap between the discipline you need and the convenience that makes it stick.
The Power of Automated Broker Synchronization
The modern fix for this age-old problem is automated broker synchronization. Instead of manually typing in your trade details, you connect your brokerage account directly to a specialized tradebook platform. The platform then instantly and perfectly pulls in every critical detail — timestamps, execution prices, quantities, and more — without you lifting a finger.
This does more than just save you a massive amount of time; it guarantees 100% data integrity. A single typo in a manual entry can throw off your entire analysis, leading you to make decisions based on bad information. Syncing eliminates that risk, giving you a clean, reliable dataset you can actually trust.
Automating the grunt work of data entry frees up your limited time and mental energy to focus on what actually moves the needle: analyzing your performance, refining your strategy, and executing better trades.
This shift lets you spend your time acting like the CEO of your trading business, not an admin assistant. It’s about building the habits of a professional without getting bogged down by the manual grind that derails so many aspiring traders.
This kind of seamless integration is the key to creating a frictionless system for consistent performance review.
From Raw Data to Instant Insights
Once your trades are automatically synced, the real work — the fun part — can begin immediately. Instead of wrestling with spreadsheet formulas, you get instant access to powerful analytics that turn raw numbers into actionable intelligence. It’s a game-changer for spotting patterns you’d otherwise miss completely.
Here are just a few things a great automated tradebook can do for you right out of the box:
- Performance Dashboards: Get a bird’s-eye view of your most important metrics like win rate, profit factor, and P&L at a glance.
- Visual Trade Calendars: See your performance laid out on a calendar to quickly identify your best and worst trading days or weeks.
- Equity Curve Trackers: Watch the growth of your account over time in a clear, visual format to understand your progress and periods of drawdown.
The technology handles all the heavy lifting, allowing you to focus purely on interpreting the story your data is telling. If you want to dive deeper, check out our guide on how to auto-import trades from your broker. Adopting these tools isn’t just a convenience; it’s a huge step toward building the sustainable, long-term habits every successful trading career is built on.
Alright, let’s put this all together.
Your tradebook is the unshakeable, factual bedrock of your trading career. Think of it as the raw data — the simple “what” and “when” of every single execution. Your journal, on the other hand, is where the story lives. It’s the rich, narrative context that digs into the all-important “why” behind each decision.
When you embrace both, you’re making a fundamental shift. You stop relying on hope and luck and start building a real trading business on a foundation of hard, undeniable evidence. This is the line that separates a hobbyist from a professional.
Play the Long Game
We’ve all been there. The sting of a losing streak hits, and the immediate impulse is to hunt for that “perfect” strategy that never fails. Let me save you some time: it doesn’t exist. There are no guaranteed profits in trading.
Real, consistent improvement doesn’t come from some magic indicator you found online. It comes from the disciplined, data-driven review of your own performance. And your tradebook? That’s your single source of truth for that data.
The entire journey to becoming a disciplined trader starts with one simple but powerful habit: maintaining and analyzing your records. Everything else grows from there.
Look, this path isn’t always easy. It demands patience. It requires you to honestly confront your mistakes, which will be laid out in black and white right there in your tradebook data. But going through that process is precisely what forges a resilient, adaptable, and ultimately successful trader.
Start building that foundation today. Your future self will thank you for it.
Still Have Questions About Tradebooks?
You’re not alone. When traders first hear about moving beyond a simple journal, a few common questions always pop up. Let’s tackle them head-on.
“Can’t I Just Do This in a Spreadsheet?”
Of course you can. In fact, starting with a spreadsheet is a fantastic way to build the core habit of logging your trades. It gets you thinking about the data that matters.
The problem is, manual entry is a huge pain and, more importantly, it’s incredibly prone to human error. A single typo can throw off your entire analysis. Automated tools that sync with your broker handle all the heavy lifting, saving you hours of tedious data entry and guaranteeing your numbers are 100% accurate.
“How Often Do I Need to Look at My Tradebook?”
The goal here is consistency, not just frequency. Many pros I know do a quick daily check-in, but the real magic happens during the weekly review.
Doing a deep dive once a week is the sweet spot. It gives you enough data to spot real patterns in your performance without getting lost in the day-to-day emotional noise of the market. For example, you can review all of the week’s trades to see if you held winners long enough or cut losers too slowly.
Making a data-driven weekly review a non-negotiable part of your routine is one of the most powerful habits you can build for long-term success.
“What’s the Single Most Important Metric to Track?”
Win rate gets all the hype, but most seasoned traders are obsessed with their Profit Factor. You find it by dividing your total gross profits by your total gross losses.
Why is it so powerful? This one number tells you exactly how much money your strategy makes for every single dollar it loses. A profit factor above 1.5 is generally considered pretty solid, and it gives you a far more honest picture of your strategy’s health than win rate ever could.
Ready to move beyond spreadsheets and automate your analysis? TradeReview syncs directly with your broker to build your tradebook for you, providing instant access to performance analytics, visual calendars, and an equity curve tracker. Start making data-driven decisions today at https://tradereview.app.


