Think of a trade journal app as your secret weapon for building consistency in the markets. It’s a digital diary that goes way beyond simple note-taking — automatically tracking, analyzing, and helping you sharpen your strategies trade by trade. Instead of just guessing what works, these apps give you the hard data to understand your wins, learn from your losses, and actually improve your decision-making.
Why Every Trader Needs a Digital Journal
Ever found yourself staring at your P&L, completely baffled by why a strategy that felt right just isn’t performing? You’re not alone. It’s a classic trader’s dilemma where emotions and a lack of clear performance data quietly wreck even the best-laid plans. It’s a frustrating place to be, but it’s a hurdle that every serious trader learns to overcome.
The most disciplined traders approach their craft like a business, and no successful business runs on guesswork. A trade journal app is your digital ledger, your performance analyst, and your personal coach, all rolled into one. It’s the tool that helps you build a process for the long haul.
From Messy Spreadsheets to Actionable Intelligence
Forget the days of wrestling with clunky spreadsheets that demand hours of manual data entry just to tell you what you already suspect. A modern trade journal app handles the grunt work for you, transforming raw trading activity into clear, actionable intelligence. This is the crucial leap you need to make to build discipline for long-term growth.
This move from manual logging to automated analysis isn’t just a niche trend; it’s becoming the standard. The broader digital journal app market was valued at USD 3.2 billion in 2024 and is projected to skyrocket to USD 10.5 billion by 2033, with trader demand for powerful analytics being a major catalyst. You can discover more insights about this growing market trend.
For a quick look at why so many traders are making the switch, here’s how a dedicated app stacks up against a basic spreadsheet.
Manual Spreadsheet vs. Dedicated Trade Journal App
| Feature | Manual Spreadsheet | Trade Journal App |
|---|---|---|
| Data Entry | Time-consuming & manual | Automated broker syncs |
| Accuracy | Prone to human error | Error-free data import |
| Analytics | Requires complex formulas | Instant, built-in metrics |
| Visuals | Basic, self-made charts | Interactive, professional dashboards |
| Psychology | Hard to track consistently | Easy tagging for emotions/mindset |
| Accessibility | Limited to device/cloud | Cloud-based, multi-device access |
Ultimately, a dedicated app delivers tangible advantages that a spreadsheet just can’t replicate:
- Error-Free Data: Automated broker syncs mean no more typos or missed entries that could throw off your entire analysis.
- Deep Analytics: Instantly see your Profit Factor, Win Rate, and Average Return without building a single formula.
- Psychological Insights: Use custom tags to link your emotional state — like FOMO, revenge trading, or overconfidence — directly to your trading outcomes.
Trading without a journal is like navigating without a map. You might get lucky on a few turns, but you have no systematic way of knowing where you’ve been or how to reliably reach your destination.
By moving from gut-feel decisions to a data-driven approach, you finally create a real system for discovering what works for you. This guide will show you exactly how to put this powerful tool to work and start building sustainable success.
What a Trade Journal App Actually Does
Think about how pro athletes obsessively review game footage. They’re not just counting scores; they’re breaking down every move, every split-second decision, to see what worked, what didn’t, and why. A trade journal app is that game footage for your trading. It’s a tool built specifically to capture the whole story behind every trade you take.
It goes way beyond a simple spreadsheet of profits and losses. A journal is your personal review tool, helping you figure out why a trade succeeded or failed. Did you lose money because your strategy was flawed, or was it a solid strategy that just got caught in ugly market conditions? That’s a critical distinction to make if you ever want to get better.
It’s a Mirror, Not Just a Ledger
At the end of the day, a trade journal app is a mirror. It shows you your real trading habits, without the emotional filter you have in the heat of the moment. It’s so easy to remember that one big win and conveniently forget the five small losses that came from being impatient. The app forces you to look at the unfiltered reality.
By logging every trade, you build an objective history of your performance. This data becomes the foundation for spotting those sneaky patterns — both good and bad — that are almost impossible to see otherwise.
A trade journal reveals the difference between a fluke win and a repeatable, edge-driven strategy. It separates luck from skill and provides the roadmap for turning inconsistent results into a disciplined process.
For example, you might feel like your “gut instinct” trades are your most profitable. But after you log 100 trades, the data might scream that those impulsive entries are your biggest money pits, while the “boring” trades that followed your plan are the real winners.
Capturing the “Why” Behind the Trade
The real magic of a trade journal app is its ability to capture the rich context that a simple P&L statement leaves out. It prompts you to record not just the numbers, but the crucial details surrounding them.
This means logging things like:
- The Strategy You Used: Was this a classic opening range breakout, a mean reversion setup, or a play on an earnings report?
- Market Conditions: Was the market trending hard, stuck in a choppy range, or was volatility through the roof?
- Your Emotional State: Did you jump in because of FOMO (Fear of Missing Out), or were you calm and just executing your plan?
- How You Managed the Trade: Did you stick to your original stop-loss, or did you drag it down hoping for a turnaround? Did you take profits at your target or get greedy?
With this data, you can start asking much smarter questions. You can filter your trades to see how a certain strategy performs only on volatile days. You can see just how much money you’ve lost on trades you tagged with “FOMO” in the last quarter. This is the kind of analysis that separates amateurs from traders who treat this like a business. The goal is to move from reactive, emotional trading to a proactive, data-driven approach built for continuous improvement.
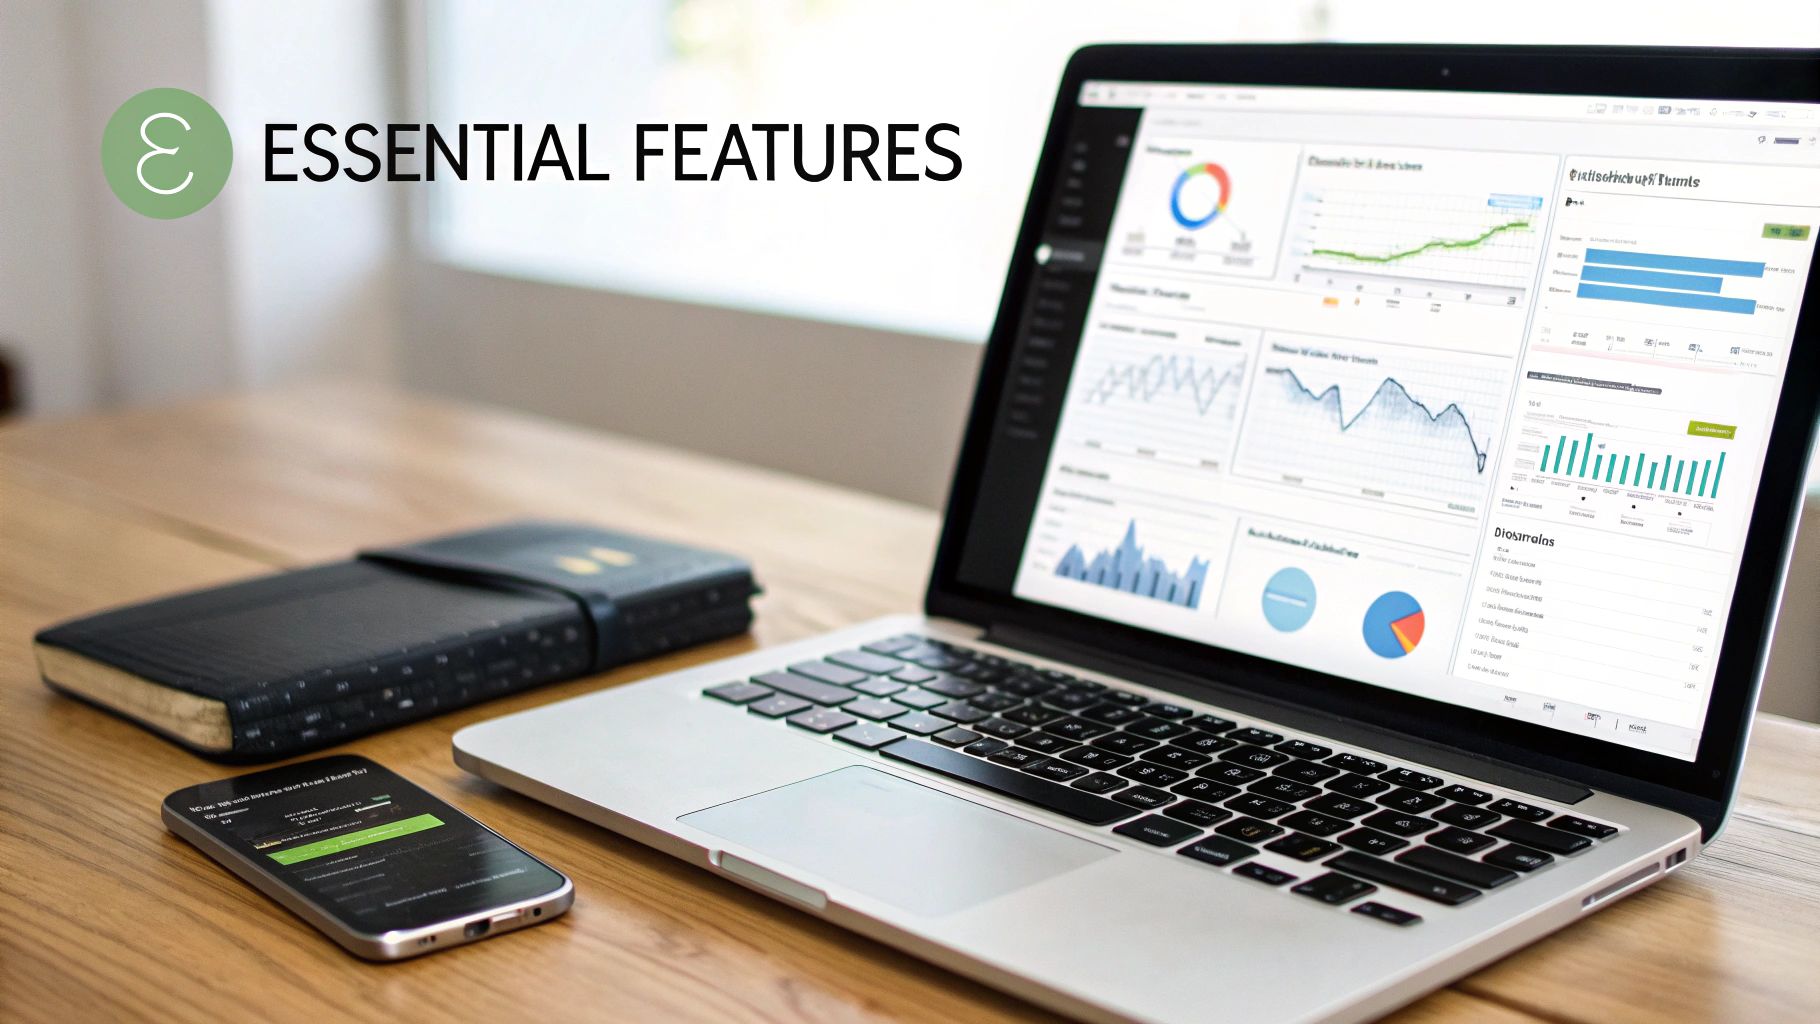
The Core Features That Actually Matter
When you start looking for a trade journal app, it’s easy to get overwhelmed by a long list of shiny features. But let’s be honest, which ones are you actually going to use? Which ones will genuinely impact your P&L?
Let’s cut through the marketing fluff and talk about the tools that solve the real-world problems traders like us face every single day. These aren’t just nice-to-haves; they are the essential building blocks for a professional trading system.
Automated Broker Synchronization
If there’s one thing that kills the journaling habit faster than anything else, it’s manual data entry. Nobody wants to spend an hour after the market closes painstakingly typing in every single entry, exit, and commission. It’s tedious, and frankly, it’s a recipe for giving up.
This is why auto-sync with your broker is a complete game-changer.
By connecting directly to your brokerage account, the app pulls in your entire trade history automatically. This does more than just save you time — it guarantees accuracy. It eliminates the little human errors like typos or completely forgetting a trade, which can throw off your entire analysis and lead you to the wrong conclusions about your strategy.
Deep Performance Analytics
A simple P&L chart tells you where you are, but it tells you nothing about how you got there. To really improve, you need to dig into the “why” behind your wins and losses. A great trade journal app gives you a dashboard with metrics that go way beyond just profit.
Look for these critical data points:
- Win Rate: The raw percentage of winning trades. It’s a good starting point, but it’s meaningless without the context of your risk/reward.
- Profit Factor: This is your total gross profit divided by your total gross loss. Anything above 1.0 means you’re profitable, but a score over 2.0 is where you start seeing some serious consistency.
- Average Win / Average Loss: This ratio instantly shows if your winners are bigger than your losers — the absolute cornerstone of sound risk management.
Your equity curve is the single most honest chart in your trading career. It visually represents your consistency, showing every peak of overconfidence and every valley of drawdown. A good journal app makes this curve the centerpiece of your dashboard.
These metrics help you understand your trading DNA. Are you a high-win-rate trader who grinds out small, consistent profits? Or are you a low-win-rate trend follower who lands a few massive winners? Both styles can work, but you have to know which one you are.
Flexible and Custom Tagging
This might just be the most powerful feature for discovering your personal edge and, more importantly, your psychological blind spots. Flexible tagging lets you attach custom labels to every trade, transforming your journal from a simple logbook into a searchable database of your own behavior.
This is how you move from generic analysis to deeply personal insights. Instead of just knowing you lost money, you can pinpoint exactly why and where.
For instance, you could create tags for:
-
Setups:
Opening Range Breakout,Mean Reversion,Earnings Play -
Market Conditions:
Trending Day,Choppy Market,High Volatility -
Psychological Triggers:
FOMO Entry,Revenge Trade,Followed Plan
After a few months, you can filter your entire trading history by these tags. You might discover your Opening Range Breakout strategy crushes it on low-volatility days but bleeds money otherwise. Or you might get a painful but necessary report showing that trades tagged Revenge Trade have cost you thousands.
This is the kind of actionable feedback that truly changes a trader’s career. The demand for this level of detail is exploding; some platforms now process over 50 million trades for more than 100,000 users, proving how critical data-driven review has become. You can learn more about the best trading journal apps and what they offer.
Visual Calendars and Multi-Platform Access
Finally, the best tools fit into your life, not the other way around. A visual trade calendar gives you a simple, at-a-glance view of your green and red days. This can instantly highlight patterns you’d otherwise miss, like if you consistently give back profits on Fridays or trade best mid-week.
And since trading doesn’t just happen at your desk, multi-platform access across web, iOS, and Android is essential. You need to be able to jot down a quick note on your phone right after a trade, then do a deep-dive analysis on your laptop over the weekend. Seamless access makes journaling a sustainable habit, not a chore.
How to Set Up Your Journal for Maximum Insight
A powerful trade journal app is a lot like a high-performance engine; its true potential is only unlocked when you set it up right. That initial configuration is your chance to build a framework that will deliver real, actionable insights for months and years. This isn’t about being a tech wizard — it’s about being thoughtful and deliberate from the get-go.
The first step is usually the easiest. Most quality apps let you sync directly with your broker, securely pulling in your entire trade history. This one action saves countless hours of manual data entry and, more importantly, gets rid of the human error that can completely mess up your analysis later.
Once your data is flowing in, the real work — and the real opportunity — begins.
Define Your Personalized Tagging System
Pay attention, because this is the single most important step you will take. A good tagging system turns your journal from a simple list of trades into a dynamic, searchable database of your own trading habits and strategies. The goal is to create labels that capture the why behind each trade, not just the what.
Think of tags as custom filters for your trading brain. They let you zero in on specific variables to see exactly how they’re performing. Without them, you just have a pile of raw data. With them, you have a precision tool for analysis.
Here’s an example of how a flexible dashboard can bring your tagged and categorized trades to life, helping you spot patterns instantly.
This kind of visual breakdown shows you in seconds which strategies or setups are actually making you money.
Start with Strategy and Setup Tags
First things first, create tags that mirror your specific trading style and the setups you look for. The trick is to be specific enough to be useful but not so granular that you end up with a hundred different tags to manage.
Here are a few practical examples to get you started:
-
For Day Traders: You might use tags like
Opening Range Breakout,Failed Follow-Through,VWAP Reclaim, orRed-to-Green Move. These describe the technical pattern that got you into the trade. -
For Options Traders: Your tags could be more about the “play” itself, like
Earnings Play,IV Crush,Covered Call, orLong Straddle. These capture the specific options strategy you rolled out. -
For Swing Traders: Think about tags like
Breakout Pullback,Moving Average Crossover, orConsolidation Break.
The idea is to organize your trades in a way that matches your personal playbook. Over time, you’ll be able to answer critical questions like, “How profitable are my Opening Range Breakout trades on high-volume days?”
Add Psychological and Mindset Tags
This is where you connect your headspace directly to your P&L. Trading is a mental game, and being honest about your emotional state is non-negotiable for growth. It can feel a little raw to admit when you’ve messed up, but that honesty is exactly what separates struggling traders from disciplined ones.
Your biggest losses will almost always be linked to a breakdown in discipline, not a flaw in your strategy. Tagging these moments is the first step toward eliminating them.
Create tags that capture your psychological state during the trade. This brings a level of self-awareness that is simply impossible to get otherwise.
Consider adding tags like:
-
FOMO Entry: For when you know you chased a trade out of fear of missing out. -
Revenge Trade: For that impulsive trade you ripped right after a loss. -
Followed Plan: A positive tag to reinforce good habits and see how your disciplined trades actually perform. -
Got Impatient: For when you bailed on a good position way too early. -
Held Too Long: For when greed kept you from taking profits at your target.
After a few months, running a report on your FOMO Entry or Revenge Trade tags can be a real gut-punch, but it’s an incredibly valuable one. It puts a hard dollar amount on your emotional mistakes, giving you a powerful reason to clean up your act.
If you’re looking for more ideas on what to track, our guide on creating a trading journal template in Google Sheets offers a solid starting point. The most important rule? Start simple. Pick 3-5 strategy tags and 3-5 mindset tags. You can always add more later. Consistency is far more important than complexity.
Turning Your Data into a Trading Edge
A journal full of meticulously logged trades is a fantastic start, but it’s like a library filled with books you haven’t read. The real magic isn’t in collecting the data; it’s in turning that raw information into a real, personal trading edge.
This transformation doesn’t happen by accident. It requires a dedicated and repeatable review process. By setting aside time each week or month to truly analyze your performance, you can shift from just reacting to the market to proactively refining your strategy based on hard evidence. This is the habit that separates traders who consistently improve from those who stay stuck in a cycle of boom and bust.
Think of it as a simple, three-step process: you sync your data, tag it with context, and then analyze the results to find your edge.
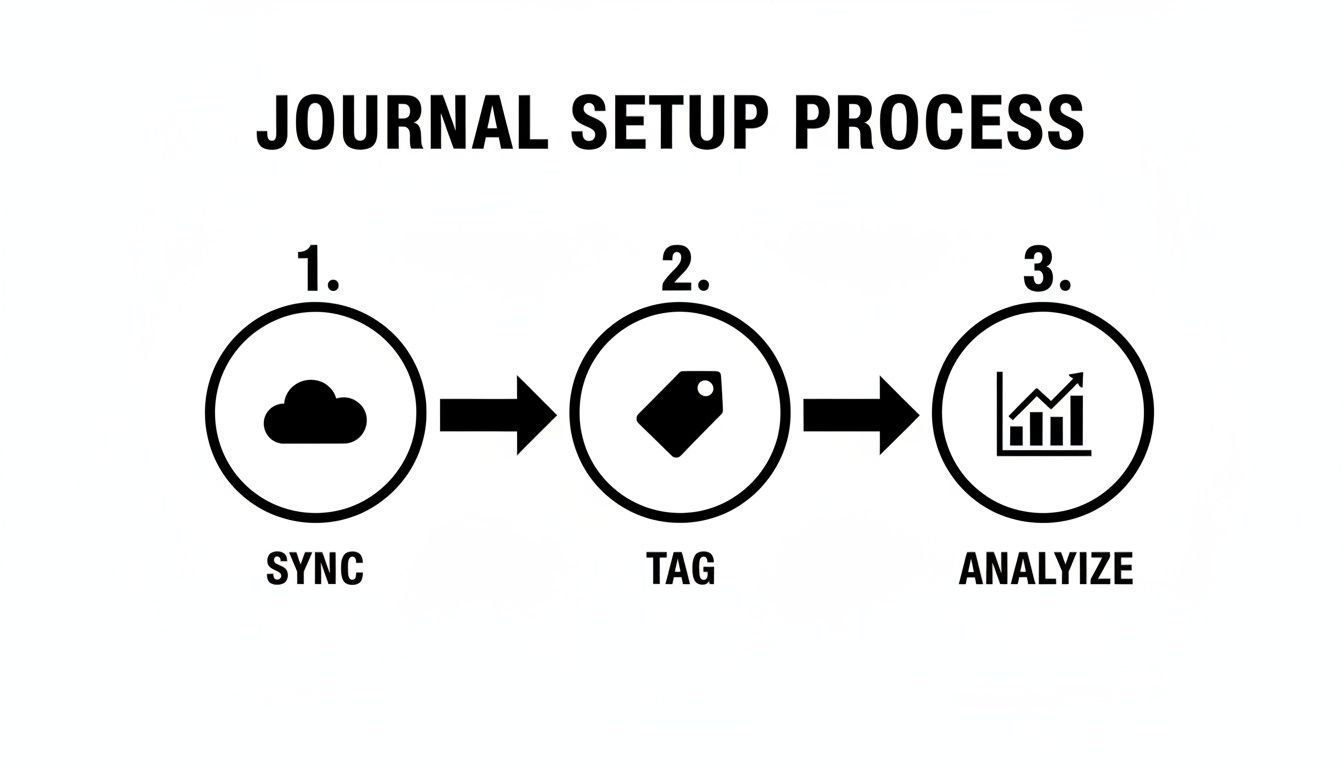
This workflow highlights how automated data collection and thoughtful tagging are the essential foundations for any meaningful analysis.
Establishing a Consistent Review Routine
Discipline is the bridge between your trading goals and your accomplishments. Your review routine is a non-negotiable appointment with yourself to work on your trading, not just in it. Whether you do it every Friday afternoon or the first Sunday of the month, consistency is everything.
During this time, your goal is to ask tough questions that your trade journal app can help you answer. Don’t just glance at your overall P&L. Go deeper by filtering your data and digging into the custom tags you’ve created.
Here are the kinds of questions that lead to breakthroughs:
- What’s the common thread in my biggest losing trades?
- Which of my custom strategy tags are actually the most profitable?
- Do I perform better when volatility is high or low?
- How much did my “FOMO Entry” trades cost me this quarter?
This structured curiosity is what unlocks your journal’s true power. With the right tools, you can explore these questions systematically. For more advanced techniques, you can learn about using pivot tables and filtering in your journal to slice and dice your data in even more powerful ways.
Interpreting Your Performance Analytics
Your equity curve is the most honest story of your trading journey. It’s a visual diary of your consistency, discipline, and even your psychological state over time. A healthy, steadily rising curve shows a solid process. A volatile, jagged one often points to emotional decisions and sloppy risk management.
When you look at your curve, pay special attention to the periods of significant drawdown.
A drawdown isn’t just a loss of capital; it’s a data point. It’s your journal telling you that something in your process broke down. Your job is to go back to that period and figure out what it was.
Go back to the trades during that slump. Were you revenge trading? Were you trying a new, untested setup? Did you ditch your stop-losses? Your journal holds the answers. Pinpointing the cause of your worst periods is one of the fastest ways to improve.
A Practical Example of Insight in Action
Let’s imagine a trader named Alex who diligently logs every trade for three months. During his monthly review, he filters his trades by the day of the week and makes a shocking discovery: while he’s profitable Tuesday through Friday, he has a net loss of over $1,500 on Mondays alone.
Digging deeper, he reviews the notes for his Monday trades. A pattern jumps out. Most are tagged with Forced Trade and Got Impatient. Alex realizes he often starts the week feeling anxious to make money, which causes him to take low-quality setups he’d normally pass on.
Armed with this data-driven insight, he makes a simple rule change: No trading for the first hour on Mondays. He uses that time to simply watch the market and wait for his best setups to form. The very next month, his Monday performance flips from red to green. That’s the entire point of a trade journal app — finding a costly, hidden habit and fixing it.
This process of turning data into actionable rules is becoming more accessible than ever. The retail trading industry is evolving, with many traders now seeking data-driven tools to find an edge. You can read the full research on the growth of the digital journal app market as more traders turn to data over gut feelings.
Choosing the Right Trade Journal App for You
With so many options out there, picking the right trade journal app can feel overwhelming. We’ve all been there — stuck comparing features, unsure of which ones will actually move the needle. The good news is, finding the best fit boils down to just a few key things.
Think of it less like shopping and more like hiring a key member for your trading team. You need a tool that’s dependable, easy to work with, and delivers the insights you need to grow.
Your Evaluation Checklist
As you start comparing apps, zero in on the core functions we’ve talked about. Does it sync with your broker without a fuss? Are the analytics clear and genuinely useful? And most importantly, is your data kept secure?
The best trade journal app isn’t the one with the most bells and whistles; it’s the one you’ll actually use day in and day out. A clean, simple interface will always beat a cluttered, complicated dashboard.
A platform like TradeReview is a great example of these principles in action. It was built with a clean, beginner-friendly design that lets you get started without a massive learning curve. At the same time, it has the powerful analytics and security that serious traders need. You can see a full breakdown and find other solid choices in our guide to the best trading journals available.
Ultimately, your goal is to find a partner for your trading journey. The right app should feel like a natural extension of your thinking, helping you connect the dots between your actions and outcomes without adding any friction. Finding an app with a free-to-use model is a huge plus, since it lets you build the crucial habit of journaling without any financial pressure. That way, you can focus on what really matters: developing the discipline and data-driven mindset for long-term success.
Frequently Asked Questions
Even after seeing the benefits, a few practical questions and common doubts can still keep traders from getting started with journaling. Let’s clear up some of the most common concerns to help you get past those final hurdles and make a trade journal app a core part of your routine.
How Many Trades Do I Need for Meaningful Patterns?
While you can learn a ton from a single, deeply analyzed trade, you’ll start to see real statistical patterns emerge after logging around 50 to 100 trades for a specific strategy. That’s usually enough data to get a solid first look at your win rate, profit factor, and which of your setups are actually making you money.
For more advanced analysis, especially the kind that uses AI to spot subtle patterns you might miss, some platforms work best with at least 200 trades. But don’t get hung up on a magic number. The key is just to stay consistent with logging your trades. The insights will follow as your journal grows.
Is It Worth It if I Only Trade a Few Times a Week?
Absolutely. In fact, it might be even more important. When you’re a swing trader or a long-term investor, every single decision carries more weight. A trade journal app makes sure each of those high-stakes decisions is thought out, tracked, and learned from.
For a swing trader, a journal is your best friend for tracking how your thesis plays out over weeks or months. It helps you look back at your entry timing, how you managed the position through all the market noise, and why you finally exited. By carefully reviewing every outcome, you get better and better at picking only the best opportunities.
For the low-frequency trader, a journal isn’t about the number of trades; it’s about making every single trade count. It turns each position into a deep learning opportunity, compounding your knowledge over time.
How Can an App Help Me Stay Consistent with Journaling?
This is the biggest hurdle for most traders, and it almost always comes down to one thing: friction. Trying to journal manually in a spreadsheet is a chore, and that’s why most people give up. A modern trade journal app is built from the ground up to remove that friction and make it easy to stay consistent.
The one feature that makes all the difference is auto-broker sync. It does the heavy lifting for you, importing all your trades automatically so you aren’t stuck doing manual data entry. This instantly solves the #1 reason traders quit journaling.
With the tedious work out of the way, your job shrinks down to the most valuable part: adding your notes and tags. If you can commit to just five minutes at the end of your day to add that context, you’re building a small, sustainable habit. The app rewards you with instant charts and clear stats, making the whole process feel less like work and more like a game you want to win.
Ready to turn your trading data into a real edge? With TradeReview, you get automated broker syncs, powerful analytics, and a simple interface designed to help you build the discipline you need for long-term success. Start journaling for free and see what insights you can uncover. Get started with TradeReview today.