Investing can feel like a rollercoaster. One day you’re celebrating gains, and the next you’re questioning every single trade. This emotional whiplash is a common struggle for traders, but the antidote isn’t a speculative stock tip; it’s clarity and discipline. We understand that feeling of uncertainty. Gaining control starts with knowing exactly where you stand, and you don’t need expensive software to do it.
This guide is for the investor who understands that consistent tracking is the bedrock of smart, long-term decision-making. We’ll explore 12 powerful tools that let you track your stock portfolio for free, moving you from reactive anxiety to a proactive, data-driven strategy. We aren’t promising guaranteed profits, because no one can. Instead, we are providing a roadmap to help you build the discipline needed for sustained growth and to understand the why behind your results.
Forget guesswork and emotional trading. This article cuts straight to the best free platforms, complete with screenshots, direct links, and honest assessments of their limitations. We will help you find the right tool to get a clear, objective view of your investments, analyze your performance, and make more informed decisions. Let’s find the tracker that fits your specific needs.
1. TradeReview
TradeReview distinguishes itself as more than just a tool to track your stock portfolio for free; it is a comprehensive trading journal engineered to facilitate genuine performance improvement. Rather than focusing solely on current portfolio value, it empowers active traders and meticulous investors to dissect their trading habits, identify recurring mistakes, and refine their strategies through data-driven analysis. Its core philosophy centers on the idea that understanding the “why” behind your trades is the key to long-term success. This makes it an exceptional choice for those committed to moving beyond passive tracking toward active, informed self-improvement.
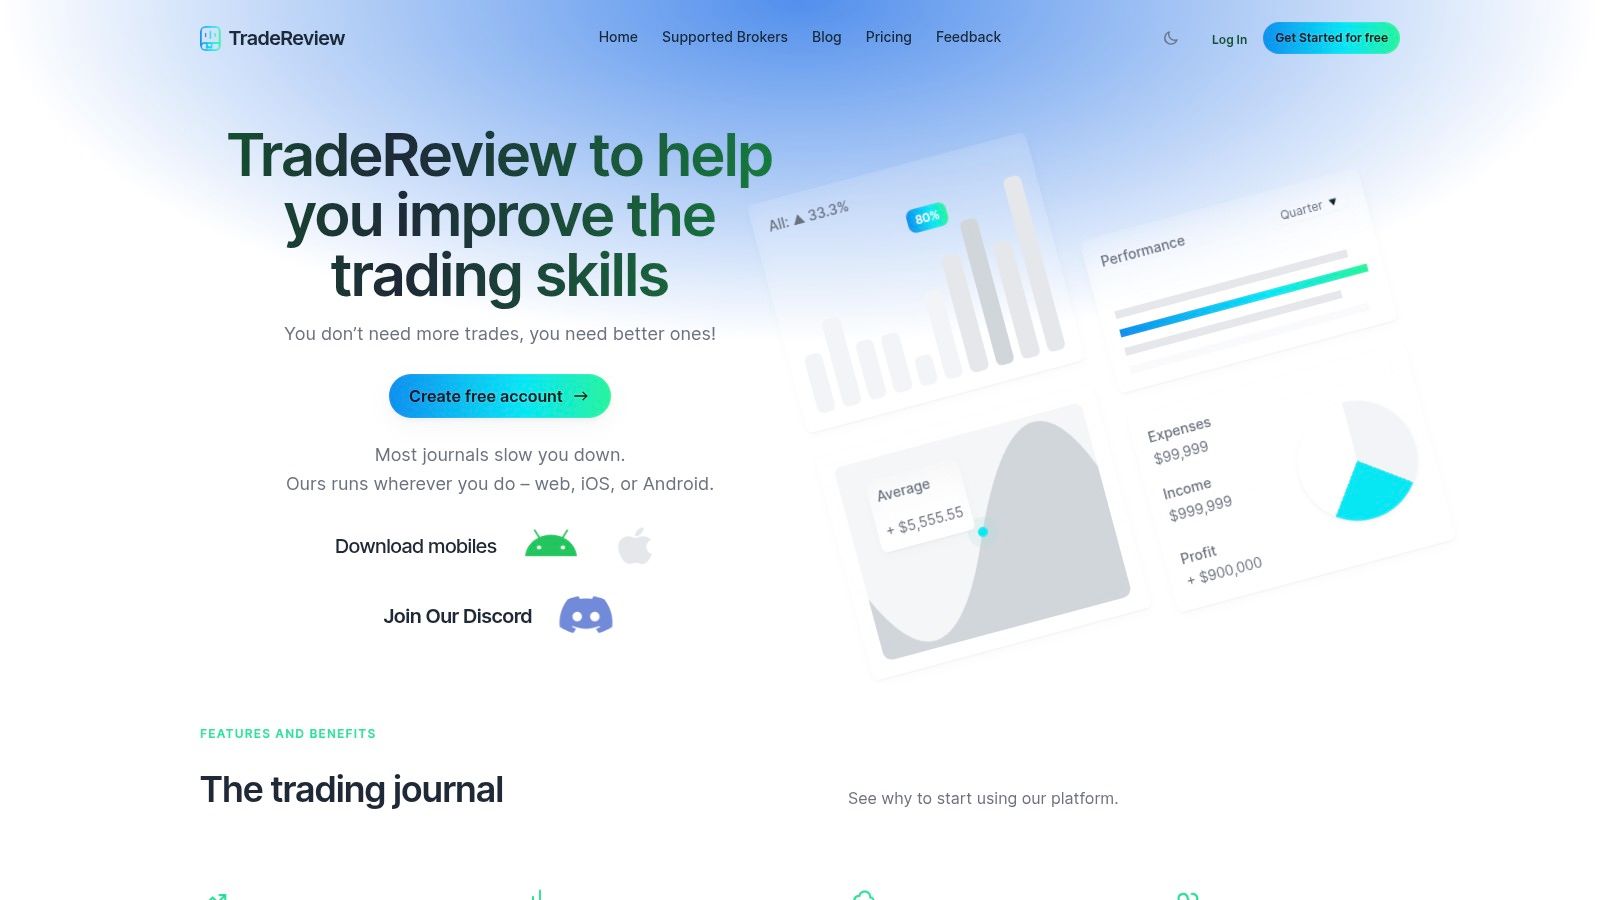
The platform is built to help you overcome the emotional challenges and cognitive biases (like Fear of Missing Out or “FOMO”) that often lead to poor trading decisions. By systematically logging your entries, exits, and the rationale for each trade, you create a powerful feedback loop. The detailed analytics then transform this raw data into actionable insights, helping you visualize your equity curve, win rates, and profit factors with clarity.
Standout Features & Analysis
- Comprehensive Trade Logging: Go beyond simple tickers and share counts. You can log detailed notes, attach charts, and use flexible tags (e.g., “earnings play,” “breakout,” “FOMO entry”) to categorize and filter your trades. For example, after a month, you could filter for all trades tagged “FOMO entry” to see exactly how much money impulsive decisions are costing you.
- Performance Dashboards: The visual analytics are a significant advantage. Instead of just seeing a P&L number, you can track metrics that reveal the health of your strategy over time. This helps you determine if a losing streak is a statistical norm or a sign of a flawed approach.
- Multi-Platform Sync: With dedicated apps for web, iOS, and Android, you can log trades immediately after execution, no matter where you are. This discipline is crucial for capturing the precise emotional and mental state at the time of the trade.
- Completely Free Access: Unlike many competitors that gate their best analytics behind a paywall, TradeReview offers its full suite of journaling and analysis tools at no cost.
Practical Use Cases
This platform is invaluable for active day traders and swing traders who need to review daily performance and identify costly habits. It is also highly effective for options traders who need to track complex multi-leg strategies and analyze their performance across different setups. New investors can use it to build good habits from the start, and it serves as an excellent companion for those practicing with simulated money. For anyone new to structured trading, you can explore the concept of paper trading on the TradeReview blog to understand how to practice without financial risk.
Best For: Active stock and options traders focused on performance analysis and strategy refinement.
| Feature | Details |
|---|---|
| Cost | Completely Free |
| Platforms | Web, iOS, Android |
| Supported Assets | Stocks, Options, Option Spreads |
| Data Import | Manual Entry, CSV Import |
| Key Advantage | In-depth performance analytics and journaling features designed for disciplined strategy improvement. |
| Primary Limitation | Lacks automatic broker synchronization (currently in development). |
Website: https://tradereview.app
2. Yahoo Finance
For investors who value a classic, data-rich interface backed by a reputable name, Yahoo Finance remains a top-tier choice to track stock portfolio free of charge. It excels at consolidating your holdings, whether you link your U.S. brokerage accounts for automatic syncing or add positions manually. This flexibility is ideal for traders who use multiple brokers and want a single dashboard to monitor everything.
The platform’s strength lies in its seamless integration of portfolio tracking with extensive market data and news. You can click any holding in your portfolio and immediately access detailed quote pages, historical charts, and relevant headlines. This makes it incredibly efficient to check performance and conduct follow-up research in one place, a feature many long-term investors and active traders will appreciate. The recent interface redesign has modernized the look, providing cleaner charts and more intuitive navigation.
Key Benefit: Yahoo Finance offers one of the most comprehensive free packages, combining robust portfolio tracking with deep research tools and real-time data, making it a powerful all-in-one hub for market analysis.
Core Features & Limitations
| Feature Breakdown | Pros | Cons |
|---|---|---|
| Account Aggregation | Connects with a wide range of U.S. brokerages for seamless, real-time updates. | Connectivity can sometimes be inconsistent; some international brokers are not supported. |
| Data & Research | Access to extensive historical price data, financial statements, and integrated news. | The most advanced analytics and fair value analysis tools are locked behind a Premium paywall. |
| User Interface | Familiar and data-dense interface that is highly functional for research. | Frequent UI updates can be disruptive for users accustomed to the previous layout. |
- Website: finance.yahoo.com/portfolios
3. Google Finance
For investors seeking a minimalist, no-frills way to track stock portfolio free of charge, Google Finance offers an exceptionally clean and straightforward solution. Integrated directly into the Google ecosystem, it allows users to manually add their holdings and monitor performance with an uncluttered, at-a-glance dashboard. Its primary advantage is speed and simplicity; there are no complex menus or upsells, making it perfect for quickly checking your overall portfolio value and daily changes.
The platform truly shines for those who are already embedded in Google’s suite of products. While it lacks direct brokerage connections, it seamlessly syncs watchlists and portfolios across any device where you are signed into your Google account. This makes it an excellent choice for a secondary tracking tool, especially for long-term investors who prefer a clean, fast-loading interface for daily check-ins without the noise of more feature-heavy platforms.
Key Benefit: Google Finance delivers an unmatched, clutter-free user experience with zero upsell friction, making it the ideal choice for investors who prioritize speed, simplicity, and easy integration with other Google services.
Core Features & Limitations
| Feature Breakdown | Pros | Cons |
|---|---|---|
| Account Integration | Syncs seamlessly across all devices via your Google account for a unified experience. | No support for direct brokerage connections; all positions must be entered and updated manually. |
| Data & Research | Provides real-time U.S. stock quotes and integrates with Google News for relevant headlines. | Lacks the deep analytical tools, advanced charting, and fundamental data found in competitors. |
| User Interface | Modern, fast, and incredibly intuitive interface that is easy to navigate. | Can be too simplistic for active traders or investors who require in-depth performance metrics. |
- Website: www.google.com/finance/portfolio
4. Investing.com
For the global investor managing a diverse portfolio, Investing.com offers a robust solution to track stock portfolio free across a vast array of asset classes. Its major advantage is the sheer breadth of instruments it covers, including global stocks, ETFs, indices, currencies, commodities, and cryptocurrencies. This makes it an ideal choice for traders who want to consolidate a multi-asset strategy, from S&P 500 stocks to Bitcoin, all within a single synchronized dashboard accessible via desktop and mobile.
The platform excels at integrating portfolio performance with real-time market context. You can easily add positions and then view your holdings alongside a dynamic economic calendar and relevant news feeds. This holistic view helps you connect macroeconomic events (like a central bank interest rate decision) to your portfolio’s performance, a critical practice for disciplined, long-term investors. While the interface can feel busy due to advertisements on the free tier, its functionality for tracking a globally diversified portfolio is undeniable.
Key Benefit: Investing.com is unparalleled in its free coverage of diverse, global asset classes, making it the go-to tracker for investors who need to monitor stocks, commodities, and crypto in one place.
Core Features & Limitations
| Feature Breakdown | Pros | Cons |
|---|---|---|
| Asset Coverage | Extensive support for international stocks, ETFs, forex, commodities, and crypto. | Lacks direct brokerage integration, requiring fully manual entry for all positions. |
| Integrated Tools | Economic calendar and news are built directly into the portfolio view for context. | The user interface can feel cluttered and overwhelming, with numerous ads on the free plan. |
| Accessibility | Seamless synchronization between a powerful mobile app and the desktop website. | Customization options for the portfolio view are less advanced than some dedicated trackers. |
- Website: www.investing.com/portfolio/
5. TradingView
For traders who prioritize technical analysis and world-class charting, TradingView offers a powerful platform where you can track stock portfolio free via its robust watchlist and charting tools. While it doesn’t offer direct brokerage integration on its free tier, its strength lies in creating and monitoring highly detailed watchlists synced across all devices. This setup is perfect for traders who base their decisions on technical indicators and want their tracking tool integrated directly into their analysis environment.
The platform is renowned for its smooth, interactive, and customizable charts, which are considered the industry standard by many. You can track your positions manually in a watchlist and immediately apply hundreds of indicators, drawing tools, and analytical overlays to each holding. This allows you to monitor performance not just by price, but by how each asset behaves relative to key technical levels (like the 50-day moving average), a critical aspect for active traders who need to understand market analysis techniques.
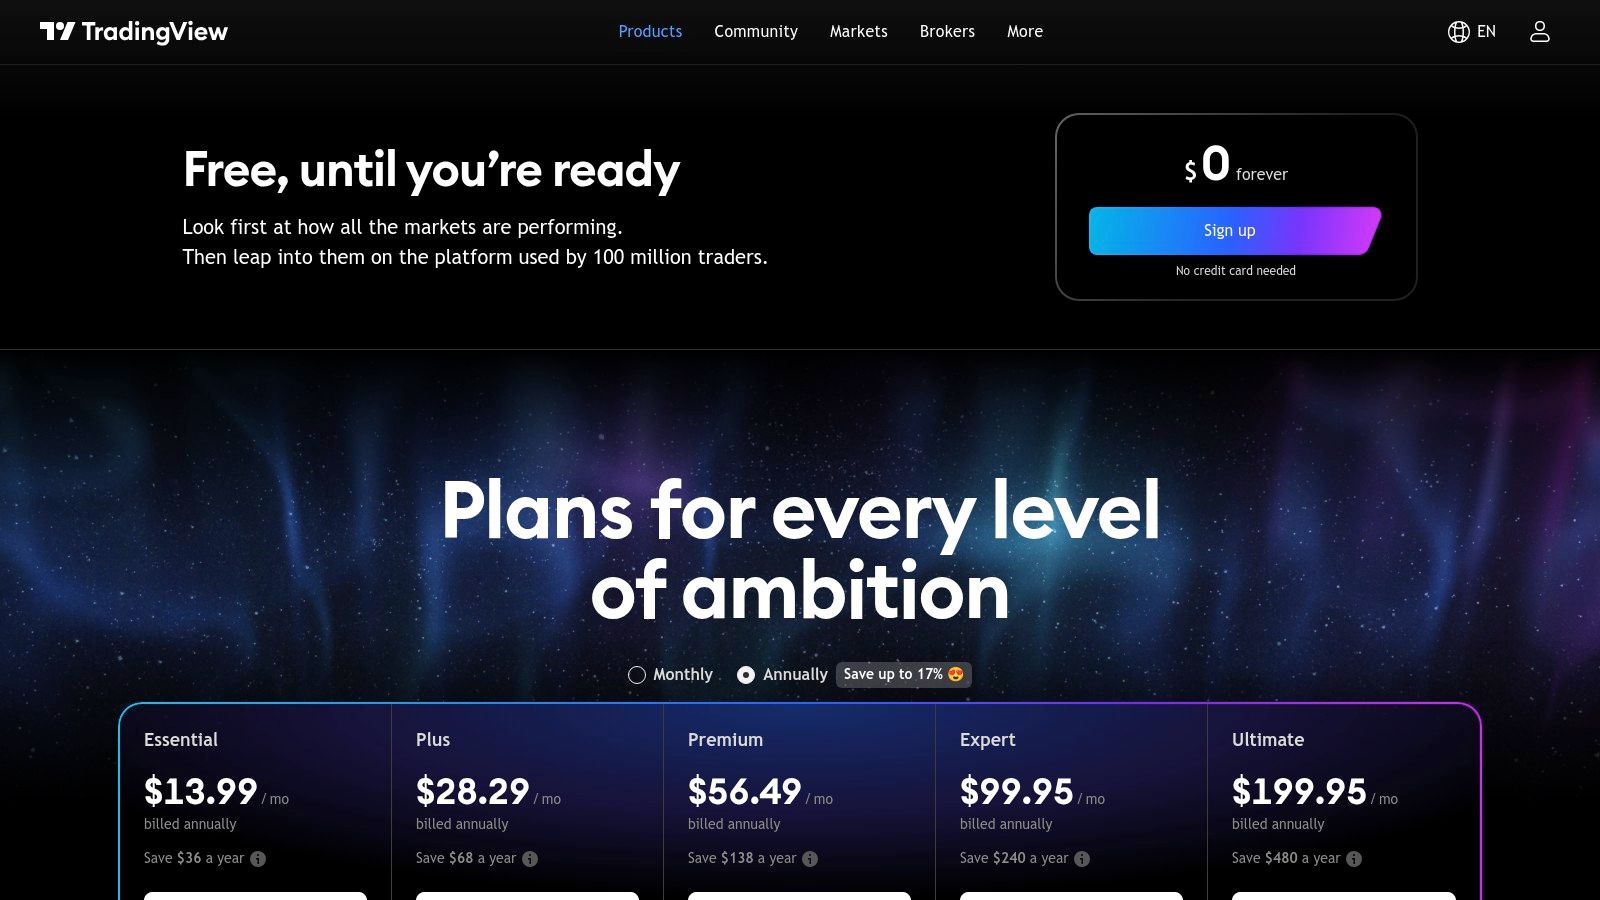
Key Benefit: TradingView provides an unparalleled charting and technical analysis experience, making it the top choice for traders who want to visually track their holdings and analyze market patterns in one seamless interface.
Core Features & Limitations
| Feature Breakdown | Pros | Cons |
|---|---|---|
| Charting & Analysis | Industry-leading interactive charts with an extensive library of indicators and drawing tools. | Free plan has ads, limits indicators per chart, and restricts advanced features like multi-chart layouts. |
| Watchlists & Alerts | Highly customizable and cloud-synced watchlists accessible on any device. | The free Basic plan only allows for one server-side alert, significantly limiting its utility for active monitoring. |
| Community & Ideas | Large social network where users can share trading ideas, scripts, and analysis. | The quality of community-generated ideas can vary greatly; requires careful vetting and critical thinking. |
- Website: www.tradingview.com/pricing
6. Koyfin
For investors seeking professional-grade analytics without the typical high cost, Koyfin offers a powerful platform to track stock portfolio free with an emphasis on deep data visualization. While many free trackers focus solely on performance numbers, Koyfin provides a more analytical experience, allowing users to build custom dashboards and charts that rival expensive institutional software. It’s designed for the serious investor who wants to move beyond basic tracking and into a more robust research environment.
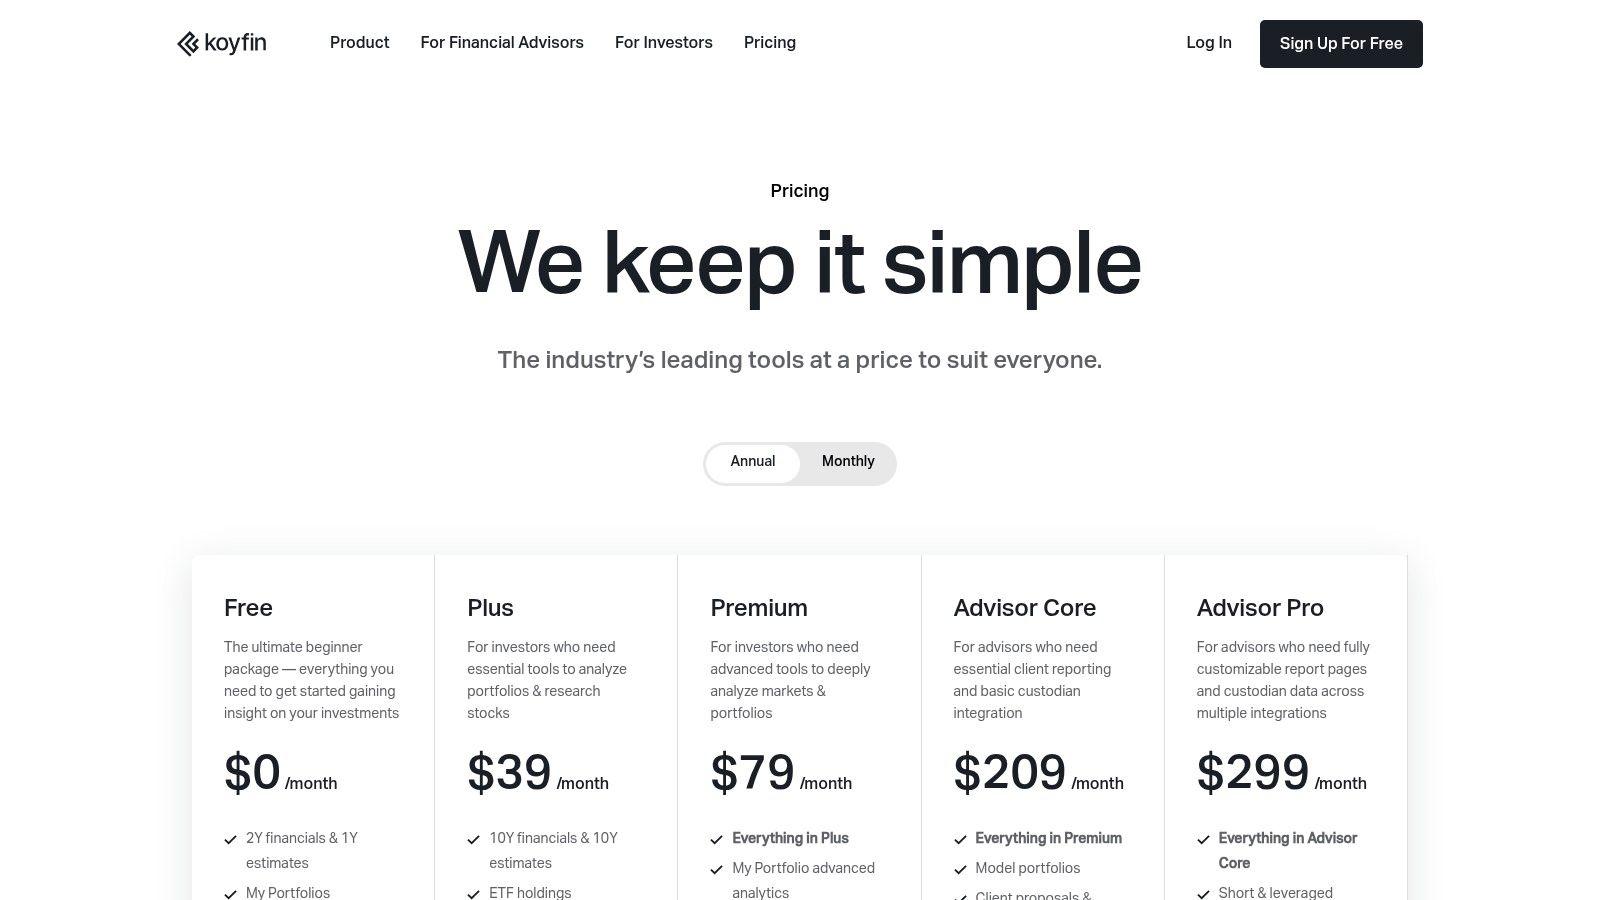
The platform truly shines in its ability to connect portfolio holdings with sophisticated financial analysis. You can manually input your positions and then leverage Koyfin’s charting tools to overlay performance against benchmarks (like the S&P 500) or analyze fundamental data trends for each company you own. This helps bridge the gap between simply watching your portfolio’s value change and understanding the underlying drivers of that change, encouraging a more disciplined and informed investment process.
Key Benefit: Koyfin provides a powerful, Bloomberg-like interface with advanced charting and fundamental analysis tools, making it an excellent free option for investors who prioritize in-depth research alongside portfolio tracking.
Core Features & Limitations
| Feature Breakdown | Pros | Cons |
|---|---|---|
| Data & Analytics | Offers exceptional charting, financial visualizations, and access to company fundamentals. | The most powerful portfolio functions, like detailed exposure analysis, are limited to paid plans. |
| User Interface | Clean, modern, and highly customizable dashboard interface that is intuitive for data analysis. | Free version limits the number of portfolios you can create and has some data restrictions. |
| Portfolio Tracking | Manual entry allows for detailed tracking of lots, cost basis, and performance. | No automatic brokerage account synchronization is available, requiring manual updates for all trades. |
- Website: www.koyfin.com/pricing
7. Empower Personal Dashboard (formerly Personal Capital)
For investors focused on a holistic view of their net worth, Empower Personal Dashboard offers a powerful way to track stock portfolio free of charge, alongside all other financial accounts. It excels at aggregating investment accounts from various U.S. brokers, 401(k)s, and IRAs, providing a comprehensive dashboard of your entire financial picture. This is especially useful for long-term investors aiming to understand their asset allocation and plan for retirement.
The platform’s standout feature is its detailed analysis tools, which are typically found in paid services. You can view your portfolio’s allocation across different asset classes, analyze investment fees to spot hidden costs (like high expense ratios in mutual funds), and use the robust Retirement Planner to see if you are on track to meet your goals. This moves beyond simple performance tracking, offering actionable insights for strategic, long-term wealth management.
Key Benefit: Empower delivers a free, high-level overview of your entire net worth, complete with sophisticated retirement planning and fee analysis tools that help you make more informed long-term investment decisions.
Core Features & Limitations
| Feature Breakdown | Pros | Cons |
|---|---|---|
| Account Aggregation | Connects seamlessly with almost all U.S. financial institutions for a complete net worth view. | Linking all accounts is required for full functionality, which may be a privacy concern for some users. |
| Analysis Tools | Free access to an excellent Retirement Planner and Investment Fee Analyzer. | The platform often markets its paid advisory services, particularly to users with higher balances. |
| User Interface | Clean, modern, and intuitive dashboard on both desktop and mobile apps. | Primarily geared towards long-term planning rather than day-to-day stock trading analysis. |
8. Sharesight
For investors focused on the true, all-in performance of their holdings, Sharesight offers a powerful way to track stock portfolio free of charge. The platform excels at automatically accounting for dividends, stock splits, and currency fluctuations, providing a complete picture of your total return. This is particularly valuable for dividend growth investors or those managing international holdings, as it removes the tedious manual calculations often required by other trackers.
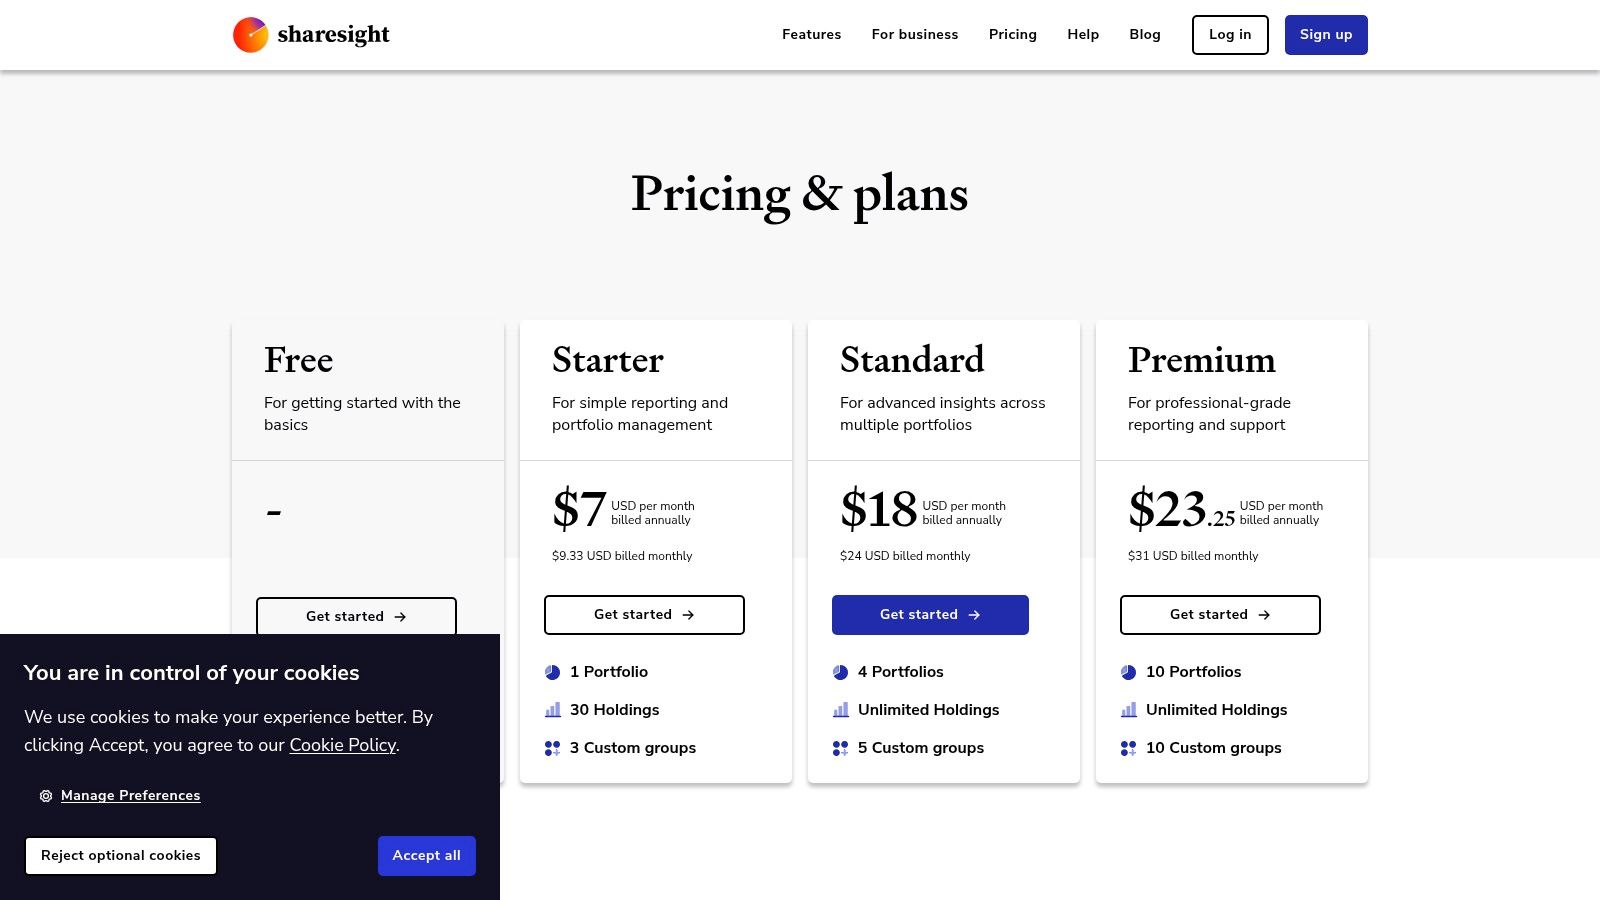
Sharesight’s free tier is generous enough for newcomers, supporting one portfolio with up to 10 holdings. You can import trades via CSV or connect with a broker, and its email-based trade confirmation import is a standout convenience. The platform’s commitment to accurate, tax-aware reporting helps investors understand not just what they made, but what they keep. For those managing holdings across multiple currencies, its performance reporting provides crucial insights that can help diversify an investment portfolio more effectively.
Key Benefit: Sharesight’s automated tracking of dividends and corporate actions delivers an accurate total return calculation, making it the ideal free tool for long-term investors who need comprehensive performance and tax reporting.
Core Features & Limitations
| Feature Breakdown | Pros | Cons |
|---|---|---|
| Performance Tracking | Automatically tracks and incorporates dividends, DRPs, and currency impacts. | The free plan limits users to basic performance and tax reports. |
| Portfolio Setup | Supports broker imports, CSV uploads, and an innovative email trade confirmation feature. | Full, direct broker sync for automatic updates is reserved for paid plans in most regions. |
| Reporting & Tax | Generates tax-friendly reports (Capital Gains, Taxable Income) suitable for annual filing. | Advanced reporting tools and benchmarking are locked behind a subscription. |
- Website: www.sharesight.com/pricing
9. MSN Money (Microsoft Start – Money)
For investors deeply integrated into the Microsoft ecosystem, MSN Money (now part of Microsoft Start) offers a clean and straightforward way to track stock portfolio free of charge. The platform is designed for simplicity, allowing users to quickly set up a watchlist or manually input portfolio holdings with just a Microsoft account. It excels at providing a no-frills, high-level overview of your investments alongside curated financial news and market data.
This tool is particularly useful for those who want a basic, reliable tracker without the overwhelming complexity of more specialized platforms. The user interface is clean and familiar, presenting essential information like daily change, market value, and relevant headlines in an easily digestible format. While it lacks advanced analytics, its strength lies in its accessibility and ease of use, making it an excellent starting point for new investors or a simple dashboard for seasoned ones.
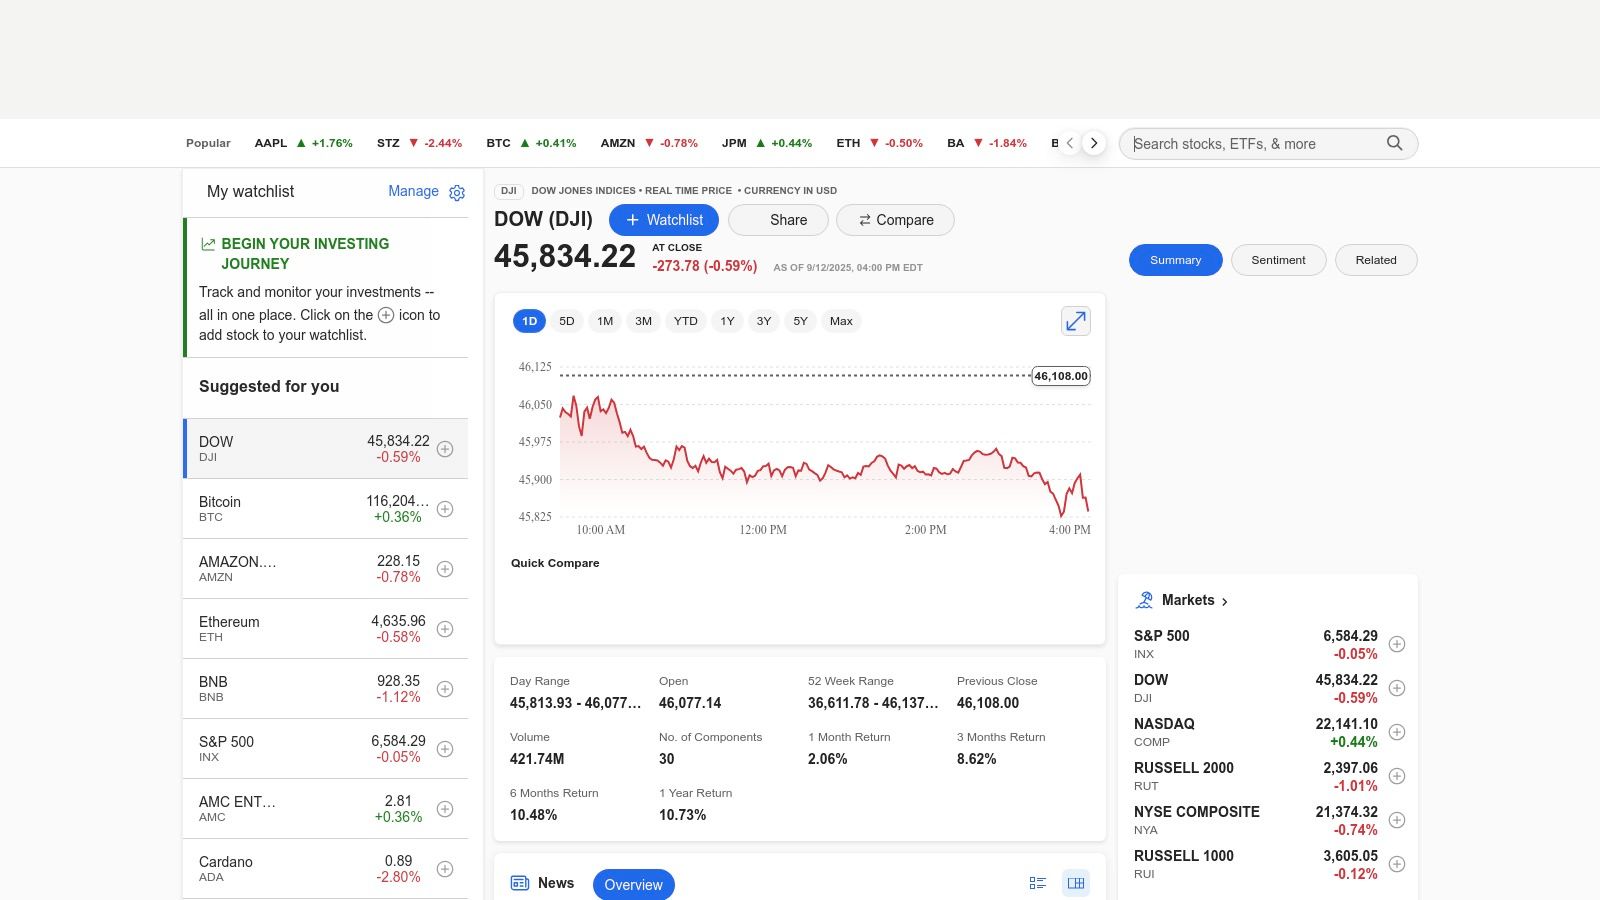
Key Benefit: MSN Money provides an incredibly user-friendly and clutter-free experience for basic portfolio tracking, making it an ideal choice for users seeking simplicity and seamless integration with other Microsoft services.
Core Features & Limitations
| Feature Breakdown | Pros | Cons |
|---|---|---|
| Ease of Use | Extremely quick setup with a Microsoft account; simple manual entry for holdings. | Does not support direct brokerage account linking for automatic syncing. |
| Data & Research | Clean quote pages with essential data, charts, and integrated news from the MSN network. | Lacks deep analytical tools, advanced charting, and comprehensive fundamental data. |
| User Interface | Intuitive and clean layout that is easy to navigate, especially for beginners. | Support documentation can sometimes be confusing with references to older, legacy versions. |
10. Seeking Alpha
For investors who prioritize staying informed with a constant stream of news and analysis, Seeking Alpha offers a powerful platform to track stock portfolio free of charge. The service excels by linking your manually entered holdings directly to its vast library of crowd-sourced articles, news, and expert commentary. This integration ensures that whenever there’s a significant development, earnings call, or new analysis piece published about a stock you own, you are promptly notified.
The platform is designed for the proactive investor who wants to understand the “why” behind market movements, not just the “what.” By default, you receive email and push alerts tied to your portfolio tickers, making it an excellent tool for monitoring your investments without having to constantly watch the market. Its consolidated dashboard provides a clear overview of performance, upcoming earnings dates, and dividend announcements, helping you maintain a disciplined and long-term perspective on your holdings.
Key Benefit: Seeking Alpha’s unique value is its deep integration of portfolio tracking with a continuous feed of relevant news and analysis, turning your portfolio into a personalized financial news hub.
Core Features & Limitations
| Feature Breakdown | Pros | Cons |
|---|---|---|
| News & Alerts | Provides a strong pipeline of news and analysis tied directly to your tickers via push and email alerts. | The high volume of emails can become overwhelming if notification preferences are not carefully managed. |
| Portfolio Tools | Helpful dividend and earnings tracking tabs make it easy to monitor key dates and income. | Advanced analytics, such as factor grades and proprietary “Quant Ratings,” require a Premium subscription. |
| User Interface | Offers a clean, consolidated view across both mobile and desktop platforms. | The free experience includes significant promotional content for the paid subscription tiers. |
- Website: https://seekingalpha.com/portfolios
11. Zacks (Free Portfolio Tracker)
For investors who anchor their strategy to specific research signals, Zacks offers a unique way to track stock portfolio free of charge, centered entirely around its proprietary ranking system. Instead of focusing on flashy charts or complex performance metrics, its strength lies in providing event-driven alerts. You can manually add your stocks, ETFs, and mutual funds and receive daily email updates tied to critical changes, such as Zacks Rank upgrades or downgrades, earnings estimate revisions, and new broker ratings.
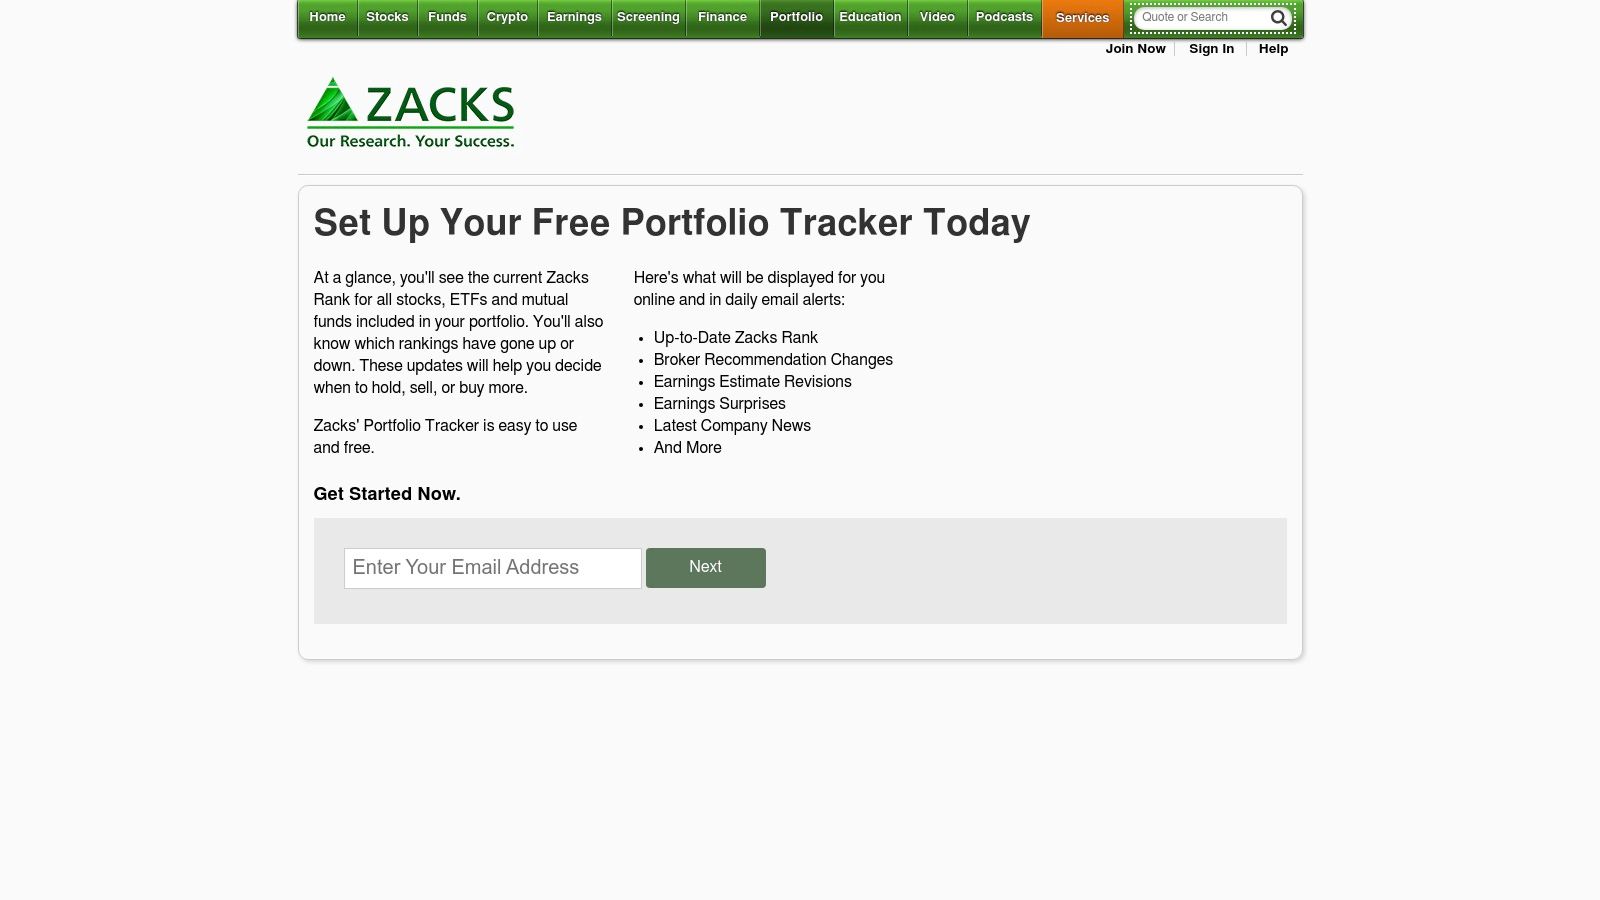
This approach makes it an excellent complementary tool for a disciplined investor who already uses another platform for primary tracking. If a sudden analyst revision on one of your holdings could trigger a re-evaluation of your thesis, Zacks ensures you get that specific alert without the noise of general market news. For example, getting an email that a stock you own was downgraded from “Buy” to “Hold” can be the perfect trigger to review your investment case for that company.
Key Benefit: Zacks provides a specialized portfolio tracker that excels at delivering actionable, event-driven alerts based on its proprietary research, helping you stay on top of fundamental changes in your holdings.
Core Features & Limitations
| Feature Breakdown | Pros | Cons |
|---|---|---|
| Alert System | Highly focused on actionable events like rank changes and estimate revisions. | Lacks customizable alerts for technical indicators or general price movements. |
| Integration | Seamlessly integrates with Zacks’ free and premium research content. | Not an all-in-one solution; it lacks brokerage syncing and advanced performance analytics. |
| User Interface | Simple, no-frills web interface that is easy to set up and monitor. | The design is dated and utilitarian, lacking the modern polish of competitor platforms. |
12. Simply Wall St
For investors who prioritize fundamental analysis, Simply Wall St offers a visually engaging way to track stock portfolio free of charge. The platform stands out by transforming complex financial data into easily digestible “snowflake” graphics, giving you an at-a-glance overview of each holding’s value, future growth, past performance, financial health, and dividend quality. You can sync holdings from over 100 supported brokers or add positions manually, making it flexible for various users.
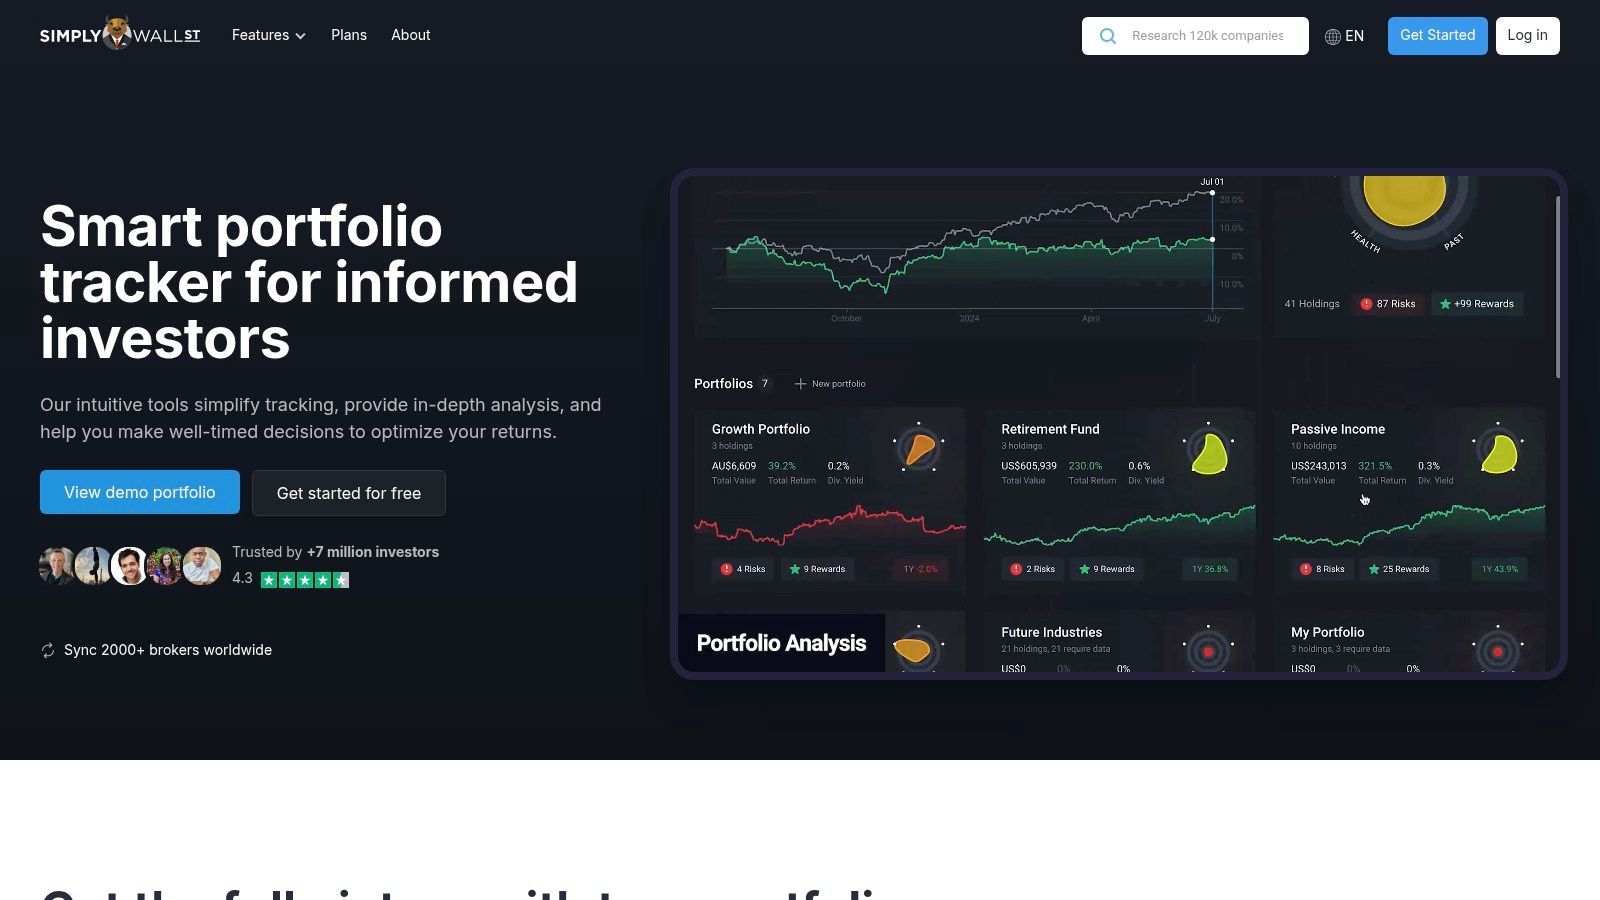
The real power of Simply Wall St lies in its ability to quickly diagnose the fundamental health of your entire portfolio. It highlights concentration risks and provides context on whether your holdings align with a value, growth, or dividend-focused strategy. This is less about tracking intraday price swings and more about understanding the underlying quality and long-term viability of the businesses you own, encouraging a disciplined, long-term perspective. A “healthy” snowflake can reinforce your conviction during a market downturn, helping you stick to your plan.
Key Benefit: Simply Wall St excels at providing deep, visual fundamental analysis of your portfolio, making it easy to identify the strengths and weaknesses of your individual holdings without digging through complex financial statements.
Core Features & Limitations
| Feature Breakdown | Pros | Cons |
|---|---|---|
| Fundamental Analysis | Unique ‘snowflake’ graphics provide a quick, visual summary of company health. | The free tier limits the number of company reports and portfolio analyses you can view each month. |
| Portfolio Health | Offers excellent overviews of portfolio concentration and factor tilts (e.g., value, growth). | It is not designed for active traders needing real-time price alerts or advanced charting tools. |
| User Interface | Clean, modern, and highly intuitive, making complex data accessible to all investor levels. | Advanced insights, such as detailed fair value calculations and broader stock coverage, are behind a paywall. |
Free Stock Portfolio Trackers Comparison
| Platform | Core Features/Characteristics | User Experience & Quality ★ | Value Proposition 💰 | Target Audience 👥 | Unique Selling Points ✨ |
|---|---|---|---|---|---|
| 🏆 TradeReview | Detailed trade logging, performance analytics, multi-device sync | Intuitive, beginner-friendly ★★★★☆ | Completely free 💰 | Day traders, stock/options traders 👥 | Real-time analytics, encrypted data storage ✨ |
| Yahoo Finance | Portfolio tracking, brokerage linking, real-time quotes | Familiar UI, solid data ★★★☆☆ | Free with paid Plus/Premium tiers 💰 | US investors, casual to intermediate 👥 | Broad US brokerage connectivity ✨ |
| Google Finance | Simple portfolio tracker, real-time prices, synced watchlists | Fast, clutter-free ★★★☆☆ | Free, no upsells 💰 | Beginners, DIY investors 👥 | Clean interface, Google Sheets integration ✨ |
| Investing.com | Multi-asset portfolios, news, economic calendar | Broad asset support ★★★☆☆ | Free with ads 💰 | Multi-asset investors 👥 | Integrated news & economic calendar ✨ |
| TradingView | Watchlists, interactive charts, alerts | Best-in-class charts ★★★★☆ | Free basic, paid advanced tiers 💰 | Technical analysts, traders 👥 | Extensive charting & indicators ✨ |
| Koyfin | Portfolio dashboards, advanced charting | Strong analytics ★★★☆☆ | Free limited, paid full features 💰 | Analysts, semi-pro traders 👥 | Balanced usability & depth ✨ |
| Empower Personal Dashboard | Account aggregation, fee & allocation analysis | Robust tools ★★★☆☆ | Free 💰 | Long-term investors, planners 👥 | Fee analyzer & retirement planning ✨ |
| Sharesight | Dividend tracking, tax-aware reports, multi-currency | Dividend focus ★★★★☆ | Free limited, paid upgrades 💰 | Dividend & international investors 👥 | Automatic dividend & corporate action tracking ✨ |
| MSN Money | Watchlists, simple portfolio management | Clean, easy setup ★★★☆☆ | Free 💰 | Casual US investors 👥 | Microsoft ecosystem integration ✨ |
| Seeking Alpha | Portfolio news, alerts, earnings tracking | Strong news flow ★★★☆☆ | Free core, paid Premium 💰 | News-focused investors 👥 | Integrated news & analysis tied to holdings ✨ |
| Zacks (Free Portfolio Tracker) | Event-driven alerts, rank/score tracking | Functional but basic ★★★☆☆ | Free, premium tiers available 💰 | Research-driven investors 👥 | Actionable estimate & rank alerts ✨ |
| Simply Wall St | Broker sync, fundamental visual analysis | Clean UI ★★★☆☆ | Free limit, paid plans 💰 | Fundamental investors 👥 | Visual “snowflake” graphics & portfolio health ✨ |
From Data to Discipline: Making Your Tracker Work for You
Navigating the world of free stock portfolio trackers can feel like sifting through a sea of data. We’ve explored a dozen powerful platforms, from the comprehensive, high-level overview of Empower Personal Dashboard to the intricate charting capabilities of TradingView and the fundamental analysis depth of Koyfin. Each tool offers a unique lens through which to view your investments, but the most advanced software is only as good as the habits you build around it.
Choosing the right platform to track stock portfolio free is the foundational first step. The real, transformative value emerges when you transition from passive observation to active, disciplined analysis. A tracker isn’t a crystal ball promising future gains; it’s a mirror reflecting the direct consequences of your decisions, strategies, and emotional responses to market volatility.
Finding the Right Fit for Your Investing Style
Your ideal tool depends entirely on your personal investment philosophy and goals. To make the best choice, consider these distinct investor profiles:
- For the Active Day Trader or Options Trader: Your focus is on granular detail, execution analysis, and rapid feedback loops. A dedicated trading journal like TradeReview is non-negotiable. It connects every entry and exit to a specific strategy, helping you identify what works, what doesn’t, and why. Pairing it with a real-time platform like TradingView for charting gives you a complete tactical toolkit.
- For the Long-Term, Hands-Off Investor: Your primary concern is asset allocation, dividend tracking, and overall net worth. A holistic aggregator like Empower Personal Dashboard or the tax-reporting powerhouse Sharesight is your best ally. These tools provide a “set it and forget it” high-level view, helping you stay aligned with your long-term financial plan without getting bogged down in daily noise.
- For the Fundamental “Stock Picker” Investor: You live and breathe company fundamentals, valuation metrics, and analyst ratings. Platforms like Seeking Alpha, Zacks, or Simply Wall St are built for you. They integrate portfolio tracking with a rich ecosystem of research and analysis, allowing you to monitor your existing holdings while simultaneously vetting new opportunities based on your core thesis.
From Implementation to Insight
Once you’ve selected your tool, the real work begins. The goal is to build a consistent review process. This isn’t about obsessively checking prices every five minutes, a habit that often leads to emotional, reactive decisions. Instead, it’s about establishing a routine, whether daily, weekly, or monthly, to ask critical questions.
Why did a particular trade succeed or fail? Is my overall asset allocation drifting away from my target? Are my dividends being reinvested according to plan? A portfolio tracker provides the raw data to answer these questions. Your discipline is what turns that data into actionable wisdom, helping you refine your strategy, manage risk, and remove emotion from the equation. By committing to this process, you empower yourself to navigate the markets not with certainty, but with clarity, confidence, and a well-defined plan.
If you’re an active trader looking to move beyond simple performance metrics, TradeReview offers a powerful free tier designed to turn your trading history into your greatest learning asset. It goes beyond basic tracking to provide in-depth analytics on your strategies, mistakes, and successes, helping you build the discipline needed for long-term growth. Start your journey toward smarter trading today at TradeReview.

