A proper profit loss analysis goes way beyond just checking if your account is green or red at the end of the day. Think of it as a systematic review of your entire trading history to understand why you’re getting certain results. It’s about finding the hidden patterns in your wins and losses to genuinely refine your strategy over time.
This disciplined process is what turns your past trades into a roadmap for future improvement.
Going Beyond Green and Red Numbers
For a lot of traders, the daily P&L statement feels like a final report card. A profitable day brings a rush of confidence, while a losing day can trigger frustration and self-doubt. We’ve all been there.
This reactive, emotional rollercoaster is a huge roadblock to long-term consistency. Relying only on this surface-level check is like trying to navigate a ship by only looking at the waves hitting the bow — you’re completely missing the currents, the wind, and the map that tells you where you’re going.
True profit loss analysis is about shifting your mindset from being a scorekeeper to becoming a detective. It’s a deliberate investigation into your trading habits to uncover the truths that a simple P&L number hides. This is where real, sustainable improvement begins.
The table below shows the mental shift required to move from a surface-level glance at your P&L to a deep, strategic analysis.
The Shift from Basic P&L Checks to Strategic Analysis
| Traditional View | Strategic Analysis View |
|---|---|
| Focuses on the outcome (win/loss) | Focuses on the process (why it happened) |
| Triggers emotional reactions | Fosters objective, data-driven decisions |
| Provides a simple daily score | Uncovers long-term patterns and biases |
| Answers “Did I make money today?” | Answers “Which strategies are really working?” |
| Leads to guessing and reactive changes | Leads to systematic, informed improvements |
Seeing your trading through the lens of a strategic analyst, rather than just a scorekeeper, is the first step toward professional-level performance.
The Real Goal of Analysis
The ultimate goal here is to move from emotional gut reactions to decisions backed by your own hard data. Instead of just feeling good about a lucky win, you should be able to pinpoint exactly which setup or strategy was responsible.
On the flip side, instead of getting angry about a loss, you should be able to identify the mistake you made or the specific market condition that led to it.
This analytical process helps you answer the critical questions that a daily P&L simply can’t:
- Which of my strategies actually works? You might feel like your breakout strategy is a winner, but the data could reveal your quiet mean-reversion trades are the ones carrying your account.
- When am I most profitable? Maybe you crush it during the morning session but consistently give back profits in the afternoon chop.
- What are my most common mistakes? The data might show a clear pattern of holding onto losers for too long or cutting your winners way too soon.
By transforming your trading history into a searchable database of your own behavior, you gain an objective perspective that’s impossible to achieve when you’re caught up in the heat of the market. This is the bedrock of a professional, strategic approach to trading.
Adopting this mindset takes discipline and a commitment to thinking long-term. It’s not about finding some magic formula for instant profits; it’s about building a resilient framework for continuous self-improvement.
With the right tools and a structured approach, you can stop guessing and start building a strategy based on what your own data proves works for you. This guide will show you exactly how.
Building Your Foundation with the Right Trade Data
Any good profit and loss analysis starts with good data. It’s that simple. The old programming adage “garbage in, garbage out” is brutally true in trading. If your analysis is limited to just entry prices, exit prices, and the final P&L, you’re trying to read a book by looking only at the first and last pages.
The real story of your trading performance — the plot twists, the characters, the climax — is hidden in the details. It’s the context surrounding each trade that turns a simple log into a powerful diagnostic tool. You have to build the habit of capturing not just what happened, but why it happened.
This means moving beyond the basics. We need to meticulously record the data points that tell the complete story of every single trade. This disciplined groundwork is what will ultimately uncover the patterns that are either making you money or costing you dearly.
Essential Quantitative Data Points
Before you can spot any patterns, you need to get the hard numbers right. Manually entering every detail is a chore and, frankly, it’s easy to make mistakes. This is where automated tools can be incredibly valuable. They pull in your foundational data cleanly and correctly, letting you focus on the more nuanced parts of your review.
Here’s the bare minimum you should be tracking for every trade:
- Commissions and Fees: These might seem small, but they add up fast. A strategy that looks great on paper can easily become a loser once you factor in all the hidden transaction costs.
- Position Size: This is mission-critical for risk management. Are your biggest losses coming from those oversized positions you took on an impulse? Your data will tell you.
- Trade Duration: Knowing how long you hold winning trades versus losing ones can reveal major psychological flaws. It’s the classic “cutting winners short and letting losers run” scenario.
- Strategy Deployed: You must tag every trade with a specific strategy (e.g., ‘mean reversion,’ ‘breakout,’ ‘earnings play’). It’s the only way to objectively figure out which of your setups actually have an edge.
Capturing the Qualitative Context
This is where most traders drop the ball, but it’s often the source of the biggest breakthroughs. The “soft” data provides the crucial context behind your decisions and can reveal deep-seated psychological habits that numbers alone can’t. You should be noting your mental and emotional state for every trade you take.
The most insightful part of a trade journal is often not the numbers, but the notes you write to your future self. Capturing your rationale and emotional state in the moment provides an honest, unfiltered look at your decision-making process under pressure.
Think about adding tags or notes that describe these elements:
- Emotional State: Were you feeling confident, anxious, greedy, or bored? Tagging trades with ‘FOMO’ or ‘Revenge Trade’ will quickly highlight your most destructive emotional triggers.
- Trade Rationale: Why did you really take this trade? Was it a well-defined technical signal from your playbook, or were you just chasing a tip you saw on social media? Be honest.
- Market Conditions: Note the broader market environment. Was it a strong trending day, a choppy mess, or a high-volatility day driven by a news event?
This combination of hard data and human context creates a rich, multi-dimensional view of your trading. For a deeper dive into structuring these records, our guide on how to create your own trading journal offers practical steps and templates.
By building this robust foundation, you empower yourself to perform a truly meaningful profit and loss analysis that actually drives real improvement.
How to Organize Your Data for Actionable Insights
Collecting trade data is the first step, but raw, unorganized information is just noise. It’s like having a library full of books with no titles or categories — the knowledge is there, but good luck finding what you need. A successful profit loss analysis hinges on how you structure this data so you can ask it specific, meaningful questions.
This is the point where your trade log transforms from a simple record into a dynamic database of your own trading behavior. The most powerful way to do this? A flexible and consistent tagging system.
The Power of a Flexible Tagging System
Think of tags as labels you attach to each trade to give it context. They let you slice and dice your entire trading history with just a few clicks. Instead of scrolling through an endless spreadsheet, you can instantly filter your performance to uncover hidden strengths and weaknesses.
This isn’t about creating some rigid, overly complicated system. It’s about developing a set of simple, personalized labels that reflect how you actually trade. The whole point is to make your data answer critical questions about your strategy and your mindset.
Here are a few categories to get you started:
-
By Instrument:
Stocks,Options,Futures -
By Timeframe:
Intraday,Swing,Position -
By Market Event:
Fed Meeting,CPI Day,Earnings Season -
By Technical Setup:
RSI Divergence,Breakout,Mean Reversion -
By Emotional State:
FOMO,Confident,Revenge Trading
Imagine the clarity you could gain. With just a click or two, you could isolate every trade tagged FOMO and see, in black and white, how much that single emotion is costing you. Or you could compare the performance of your Breakout strategy on Tech Stocks versus Industrial Stocks. This is where the real “aha!” moments happen.
A disciplined tagging system is the bridge between raw data and actionable intelligence. It turns “I think this strategy works” into “I know this strategy has a profit factor of 1.8 on Tuesdays.”
Practical Examples of Tagging in Action
Let’s make this real. A trader, let’s call her Jane, has a hunch she performs poorly on Fridays. For a month, she diligently tags every single trade with the day of the week. When she sits down to review, she filters her journal.
The results are stark: her win rate from Monday to Thursday is 58%, but on Fridays, it craters to just 35%. She digs a little deeper and notices most of her Friday trades are also tagged Afternoon Session. The data tells a clear story — she’s giving back her weekly profits by forcing trades in the low-volume Friday afternoon chop. The solution? She creates a new, hard-and-fast rule: no new trades after 1 p.m. on Fridays.
This is the kind of specific, data-driven rule that separates consistently profitable traders from everyone else. It’s not based on a gut feeling; it’s based on cold, hard evidence from her own performance.
Beyond Tags: Using Visual Tools
While tags are foundational, visual tools can reveal patterns that are tough to spot in a spreadsheet. A trade calendar, for instance, can instantly highlight your best and worst-performing days of the week or month. Seeing a sea of red on certain days provides immediate, visceral feedback that’s hard to ignore.
This disciplined approach is also your best defense against catastrophic errors. While your personal account is on a different scale, the lessons from institutional failures are powerful. Some of the most well-known history of major trading losses were caused by rogue traders who were able to hide their actions because of a lack of transparent, systematic oversight.
By structuring your data with care, you build a system of personal accountability. It makes it much harder for emotional or undisciplined decisions to fly under the radar. Your journal becomes your risk manager, your strategist, and your trading coach, all in one.
Calculating and Visualizing Key Performance Metrics
Now that your trade data is clean and organized, the real analysis begins. This is where you dig deeper than a simple P&L number and start calculating the metrics that truly reveal whether your strategy has an edge.
It’s a classic trap for traders to fixate on the final profit or loss. But a single massive win doesn’t mean your strategy is sound, and one bad loss doesn’t mean it’s broken. Real insight comes from a balanced set of metrics that tell the whole story.
This process is all about turning raw numbers into a clear picture of your performance.
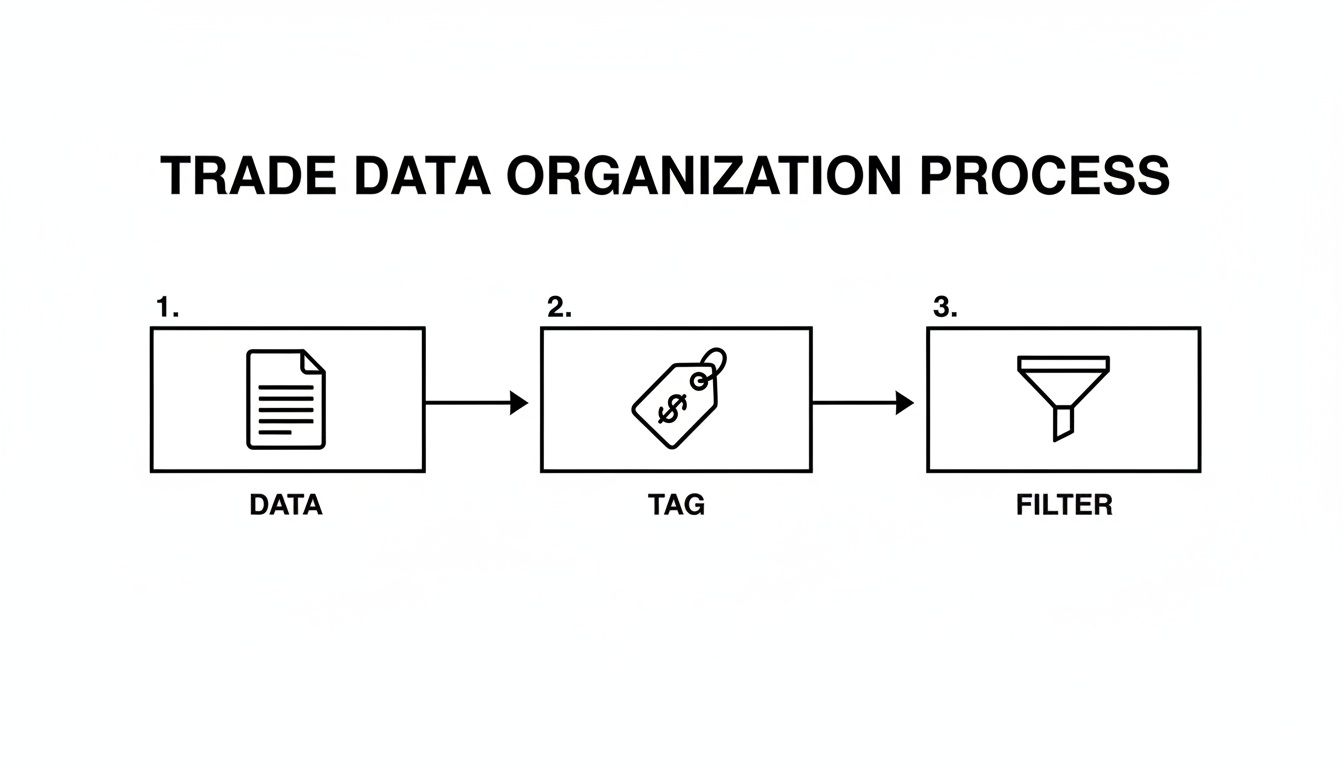
As the visual shows, once raw data is tagged with the right context, you can filter it down to find the actionable insights we’re about to cover.
Moving Beyond a Simple Win Rate
One of the first metrics new traders latch onto is the Win Rate. It’s easy to understand: the percentage of your trades that make money. While it feels great to boast about a 60% win rate, this number is dangerously incomplete on its own.
We’ve all heard stories of traders who win constantly but still manage to blow up their accounts. How? Because their few losses are so catastrophic they wipe out dozens of small wins. A high win rate means nothing if your risk management is flawed.
The most dangerous narrative in trading is a high win rate paired with catastrophic losses. Your profit loss analysis must focus on the relationship between how often you win and how much you win or lose.
To get a real feel for your performance, you have to look at your win rate alongside the relationship between your average winning trade and your average losing trade.
Here’s a quick example:
- Trader A: Has a 70% win rate. Their average win is $100, but their average loss is -$400.
- Trader B: Has only a 45% win rate. Their average win is $500, but their average loss is -$150.
Even though Trader B wins far less often, they are dramatically more profitable over the long run. Trader A is picking up pennies in front of a steamroller — it works until it doesn’t. This is precisely why you have to analyze these metrics together.
The Most Revealing Performance Metrics
A solid profit and loss analysis dashboard calculates all of this for you automatically. Your job is to understand what these numbers are telling you.
Here are the core metrics you should be watching like a hawk:
- Profit Factor: This is arguably the single most important metric. It’s your Total Profits divided by your Total Losses. Anything above 1.0 means your strategy has a positive expectancy. A higher number indicates a healthier edge.
- Average Win vs. Average Loss: Just like in our example, this ratio shows if your winners are big enough to pay for your losers. A healthy ratio where your average win is significantly larger than your average loss is a sign of great risk-reward management.
- Expectancy: This number tells you what you can expect to make or lose, on average, every time you place a trade. It combines your win rate and average win/loss into one figure, giving you a clear look at your mathematical edge.
If you want to get into the weeds on the formulas, our article on calculating trading profit breaks it all down.
The Power of the Equity Curve
While numbers tell part of the story, nothing visualizes your trading journey better than an Equity Curve. This is a simple line chart that plots your account balance over time.
It’s the ultimate lie detector.
An equity curve that trends smoothly upward from left to right signals a consistent, stable strategy. One that looks like a violent rollercoaster, with huge spikes and gut-wrenching drops, points to a high-risk approach that will be psychologically difficult to stick with over the long haul.
Your equity curve also brings your drawdowns to life — the drops from a peak to a trough in your account balance. Seeing these visually helps you understand the real emotional toll your strategy can take. This is crucial for survival, as it forces you to be honest about whether you can stomach the losing streaks that every single trader faces.
Turning Your Analysis into a Better Trading Strategy
Alright, you’ve done the heavy lifting. You’ve crunched the numbers, stared at your equity curve, and have a list of your key performance metrics. Now for the most important part: turning those cold, hard facts into real, actionable changes to your trading strategy.
This is where the real work — and the real progress — begins. Data is just noise until you give it meaning. The goal here is to use your findings to build a smarter, more disciplined trading plan that’s based on evidence, not gut feelings or emotion.
It all comes down to asking the right questions and being brutally honest with yourself about what the data is telling you. This process is what transforms a one-off report into a powerful, continuous feedback loop for building skill and finding long-term consistency.
Asking the Right Questions
Your analysis has handed you a pile of clues; it’s time to play detective. The objective is to isolate the variables that have the biggest impact on your P&L and understand the story they tell. By filtering your trade data using the tags you created, you can start to connect dots you never even knew existed.
Start by digging into specific scenarios your metrics have uncovered:
- Time-Based Performance: Does your profit factor look amazing in the morning session, only to tank after lunch? Is there a particular day of the week where you consistently give back all your gains?
- Strategy Effectiveness: Is your ‘breakout’ strategy a winner on tech stocks but a consistent loser on utilities? Maybe your ‘mean reversion’ setup is profitable overall, but a total money pit during high-volatility news events?
- Execution Flaws: Are you constantly cutting your winners short while letting your losers run wild? Does the data show that your average loss is 2x or 3x your average win?
These aren’t just random hypotheticals. They are the exact kinds of patterns that jump out from a thorough review. Each one is a breadcrumb leading you toward a significant tweak in your strategy.
From Insight to Actionable Rules
Once you’ve spotted a clear pattern, the next step is to hammer it into a specific, non-negotiable rule in your trading plan. Vague goals like, “I’ll try to trade better in the afternoon,” are completely useless. Your rules need to be black and white, leaving zero room for emotional overrides when you’re in the heat of the moment.
Let’s walk through a real-world example. A trader, Alex, runs his profit loss analysis and finds a huge problem. His trades tagged Earnings Play have a fantastic win rate of 65%, but his overall profit factor is a dismal 0.8. Something is clearly wrong.
Digging deeper, he filters to see only his losing earnings trades. A pattern immediately emerges: they all share the Wide Spreads and Low Volume tags. The data shows he’s getting absolutely crushed by slippage (the difference between expected and actual execution price) and bad fills on illiquid stocks, which is wiping out all the profits from his good trades.
The most powerful trading rules aren’t found in a book; they’re forged from the painful, expensive lessons hidden in your own trading data. Your analysis is the tool that uncovers them.
Based on this insight, Alex doesn’t just promise to “be more careful.” He creates a new, hard-and-fast rule and adds it to his pre-trade checklist:
Old Approach: “I will trade stocks with upcoming earnings.”
New Data-Driven Rule: “I will only trade earnings plays on stocks with an average daily volume over 1 million shares and a bid-ask spread under $0.05 at the time of entry.”
This new rule is specific, measurable, and directly plugs the biggest leak in his strategy. This is exactly how a professional uses analysis to systematically improve their approach, turning a losing strategy into a potentially profitable one.
Building a Continuous Feedback Loop
This whole process isn’t a one-and-done event. The market is always changing, and your strategy needs to evolve with it. Your profit loss analysis should be a living, breathing part of your trading routine — a constant cycle of trading, logging, analyzing, and adapting.
Think of it as a simple, repeatable loop:
- Execute your current trading plan with discipline.
- Capture the trade data automatically and add your contextual tags.
- Analyze your performance on a regular schedule, like every week or month.
- Adapt your trading plan with new, specific rules based on what the data reveals.
This iterative process builds the discipline and long-term thinking required for sustained success. It shifts your focus from chasing a “perfect” system to constantly refining an approach that actually fits you and the current market. This is also a core principle behind improving strategies with historical data, a topic you can dive into by exploring techniques for backtesting your trading strategies.
By making this feedback loop a core part of your routine, you ensure every single trade — win or lose — becomes a valuable lesson that makes you a sharper, more resilient trader tomorrow.
Common Profit Loss Analysis Pitfalls to Avoid

Starting a disciplined profit loss analysis is a huge step forward, but even the most careful traders can fall into some pretty common psychological traps. Just being aware of these pitfalls is your best defense against misreading your own data and making bad decisions because of it.
One of the sneakiest hurdles is confirmation bias. This is the tendency to seek out and favor information that proves what we already believe. In trading, this might look like you unconsciously focusing on the big winners from your favorite “breakout” strategy while completely glossing over all the small losses that are slowly bleeding your account dry.
To fight this, you have to actively play devil’s advocate with yourself. Don’t just hunt for what’s working; make a point to filter for your absolute worst-performing setups. Forcing yourself to look at the ugly data is the only way to get a real dose of objectivity.
Overlooking Outliers and Hidden Costs
Another major trap is letting a single, massive win completely warp your perception of a strategy’s real performance. That one incredible trade can create an emotional high that makes you forget the ten mediocre ones that came before it.
An outlier win feels great, but it’s often the enemy of long-term consistency. Your analysis must focus on what is repeatable, not what was a rare stroke of luck.
To get a much truer picture, start looking at your median P&L in addition to the average. The median isn’t as easily skewed by those extreme home-run trades, so it can give you a more realistic expectation for what a typical trade will actually produce.
Finally, a critical and surprisingly common error is forgetting about all the “invisible” costs that add up. These are the little things that slowly eat away at your bottom line:
- Commissions and Fees: They seem small on any single trade, but over hundreds of trades, they can take a serious bite out of your profits.
- Slippage: This is the gap between the price you expected to get and the price you actually got filled at. It can be a significant cost in fast-moving markets.
- Inconsistent Journaling: Every trade you forget to log creates a blind spot in your data, making your entire analysis less reliable.
By staying vigilant for these biases and errors, you make sure your profit loss analysis is a tool for genuine insight, not just a way to fool yourself. This kind of objective self-assessment is really a cornerstone of long-term trading discipline and success.
A Few Common Questions
Diving into a disciplined profit loss analysis usually brings up a few questions, especially around how to build a routine and where to focus your energy. Let’s tackle some of the most common ones.
How Often Should I Be Doing This?
Consistency is way more important than intensity here. If you try to do a massive deep-dive every single day, you’re just going to burn out. The key is to find a rhythm that actually sticks.
A three-tiered approach can work well for most traders:
- Quick Daily Check-in: Take five minutes after the market closes. Log your trades, add your tags, and jot down a few notes while the “why” is still fresh in your mind.
- Weekly Review Session: Block out an hour over the weekend. This is your time to zoom out, look for patterns in the week’s trades, and see how your core metrics are shaping up.
- In-Depth Monthly Analysis: At the end of the month, you can really assess the big picture. How does your equity curve look? Is a particular strategy underperforming? This is where you make high-level adjustments for the month ahead.
This breaks the whole process down into a manageable habit, not some overwhelming chore you dread.
Can This Really Help My Trading Psychology?
Absolutely. In fact, it’s one of the most powerful tools you have for improving your mental game. Bad, emotional decisions love to hide in the dark, but a proper P&L analysis shines a big, bright light on them. It replaces vague “gut feelings” with cold, hard data.
It’s one thing to feel like you’re chasing trades out of FOMO. It’s another thing entirely to see that trades you’ve tagged ‘FOMO’ consistently end up being your biggest losers. That’s undeniable proof of a psychological leak you have to plug.
This kind of objective feedback is your best defense against fear and greed. It builds the discipline you need to actually trust your plan, especially when you hit those inevitable losing streaks that get in every trader’s head.
If I Can Only Track One Thing, What Should It Be?
While you really need a few metrics to see the full picture, if you were forced to pick just one, it would be the Profit Factor. It’s calculated by dividing your total gross profits by your total gross losses, and it’s brilliant because it perfectly balances how often you win with how much you win.
A Profit Factor above 1.0 indicates that, on the whole, a strategy is profitable. Focusing on slowly and consistently improving this single number is one of the best goals you can set. It naturally forces you to cut your losers and let your winners run — the two things that truly define a successful trader over the long term.
Ready to turn your raw trade data into an actionable edge? A quality trading journal gives you the performance analytics, dashboard overview, and data import features you need to run a professional profit loss analysis without all the manual grunt work. Start building your data-driven advantage today.