
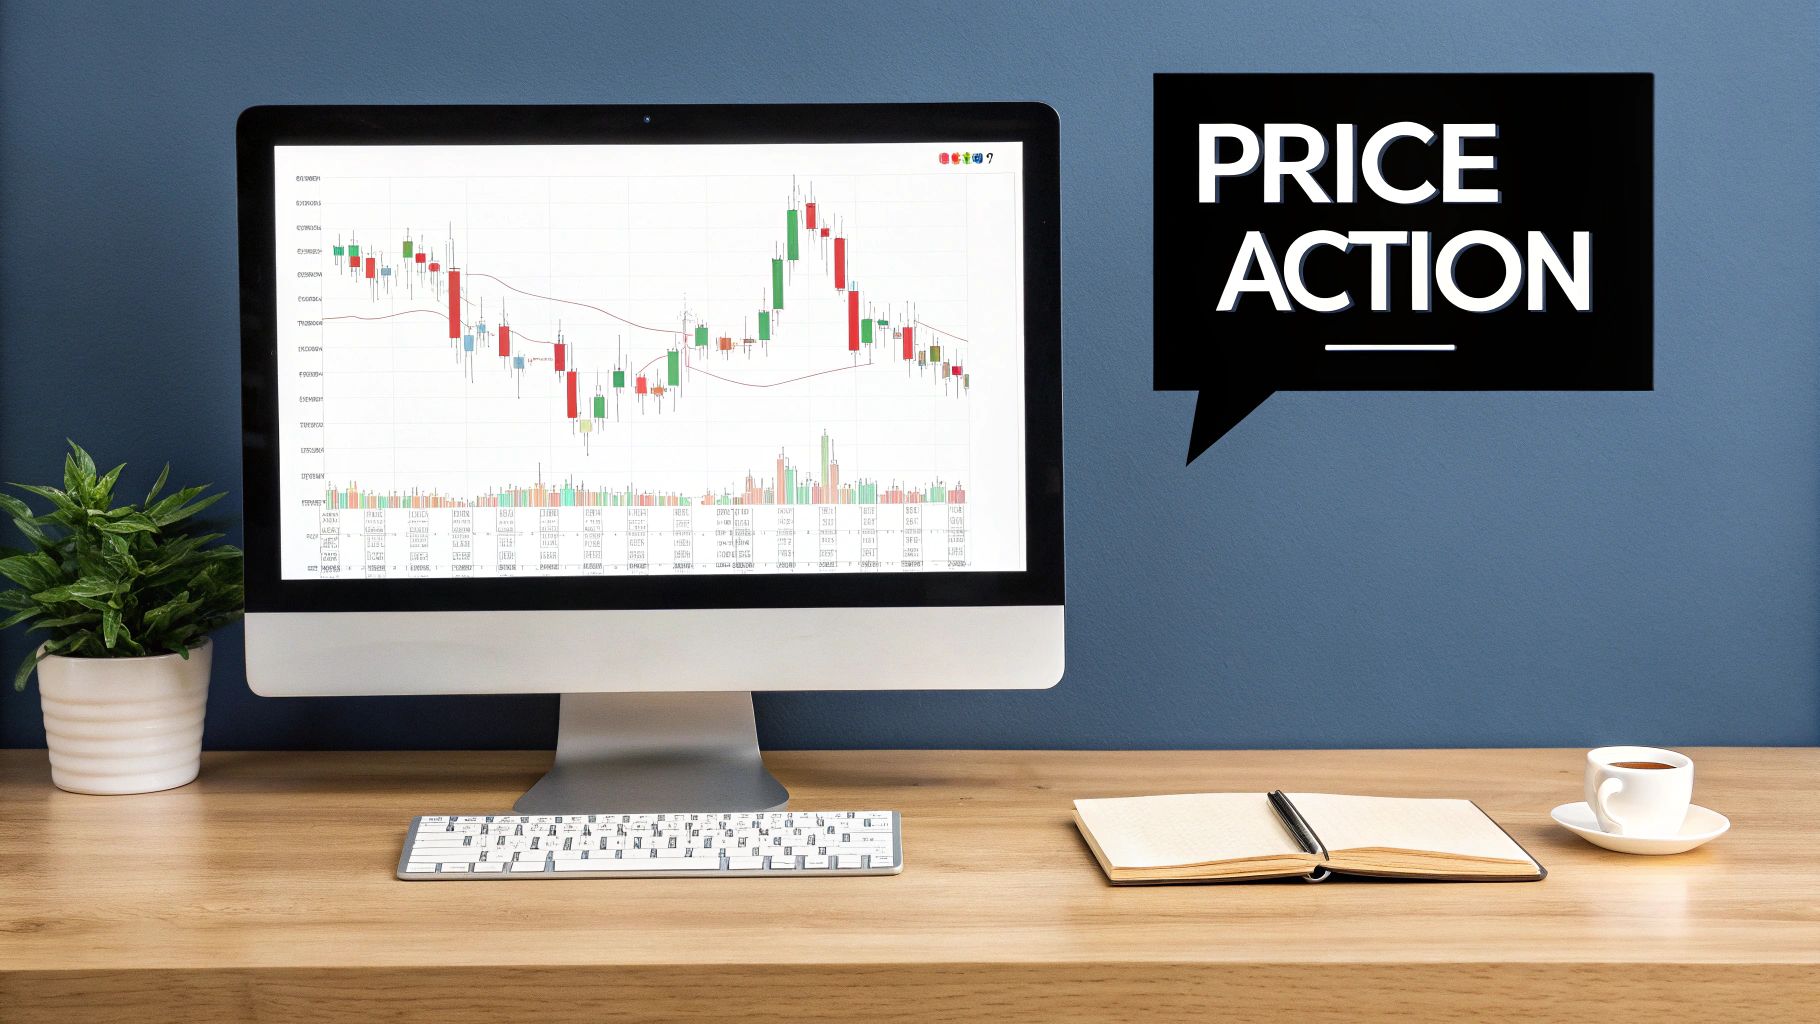
Price action trading is all about making decisions based on one thing: the price movement you see on a clean chart. That means no lagging indicators, no cluttered screens — just a raw look at how an asset’s price is behaving over time. Many traders find this liberating, as it moves them away from confusing signals and closer to the market’s true pulse.
This approach is about learning to read the story the market is telling. We’ve all felt the sting of a trade gone wrong, wondering if we missed something obvious. By analyzing candlestick patterns, market structure, and key support and resistance levels, you get a direct view into the constant battle between buyers and sellers. You’re reading the market straight from the source: price itself.
What Is Price Action Trading And Why Does It Matter
If you’ve ever found yourself staring at a chart loaded with a dozen different indicators — moving averages, RSI, MACD, Bollinger Bands — you know how confusing it can get. One tool might flash a “buy” signal while another screams “sell,” leaving you stuck. This common frustration is often called ‘indicator paralysis,’ and it’s a major hurdle for a lot of traders, both new and experienced.
Price action trading cuts through all that noise. Instead of trying to make sense of tools that are just mathematical derivatives of price, you learn to interpret the raw data directly.
Think of it this way: indicators are like a book summary written by someone else, while price action is the original story, told in its own language. Learning to read it gives you an unfiltered view of what’s really happening in the market.
The Philosophy of Simplicity
At its heart, price action trading is built on a simple but powerful idea: all the important market information is already reflected in the price. Economic news, earnings reports, geopolitical events — it all funnels down into one final output: the price movement on your screen.
When you focus on that movement, you start to develop a much deeper, more intuitive feel for market dynamics. It forces you to think critically about what buyers and sellers are trying to accomplish at any given moment.
Price action is the footprint of money. By learning to read the patterns left behind, you’re not predicting the future; you’re making educated decisions based on the current balance of supply and demand.
This shift in mindset is a game-changer. It turns you from a passive follower of signals into an active interpreter of market behavior. It’s a journey, not a destination, but it’s one that builds true market understanding.
Why This Approach Builds Better Traders
Embracing price action helps you build the essential skills you need for long-term success. It’s not some magic formula for easy profits, but a solid methodology for creating a robust and adaptable trading framework. The journey can be challenging, but the skills you gain are invaluable.
Here’s why it works so well:
- It’s Universally Applicable: The principles of supply and demand are the same everywhere. Once you understand how to read a chart, you can apply your skills to any market — stocks, forex, crypto, or commodities.
- It Develops Real Discipline: With no indicators to blame for a bad trade, you have to take full ownership of your decisions. This forces you to create clear, non-negotiable rules for your entries, exits, and risk management. This accountability is crucial for growth.
- It Reduces Lag: By their very nature, indicators are lagging because they’re calculated using past price data. Price action, on the other hand, is happening right now. It gives you a real-time perspective on market strength and weakness.
Ultimately, price action trading empowers you to become a more self-reliant and confident trader, ready to navigate the markets with clarity and purpose.
Price Action vs Indicator-Based Trading
To really get the difference, it helps to see the two philosophies side-by-side. While both aim to find profitable opportunities, their methods for getting there are fundamentally different. Price action is about direct interpretation, while indicators offer a statistical summary.
| Aspect | Price Action Trading | Indicator-Based Trading |
|---|---|---|
| Core Philosophy | Price itself contains all necessary information. | Mathematical formulas on past prices can help anticipate future moves. |
| Chart Appearance | Clean, with only price bars, trendlines, and S/R levels. | Can be cluttered with overlays (moving averages) and oscillators (RSI, MACD). |
| Decision-Making | Discretionary, based on chart patterns and market context. | More mechanical, based on signals like crossovers or overbought/oversold levels. |
| Timing | Real-time, as it’s based on current price movements. | Lagging, since indicators need past data to generate signals. |
| Learning Curve | Steeper initially; requires significant screen time to build intuition. | Can feel easier to start, but often leads to “indicator paralysis.” |
| Flexibility | Highly adaptable to all markets and changing conditions. | Can be rigid; indicators may fail in certain market environments (e.g., ranging vs. trending). |
Each approach has its place, but price action trading builds a foundational skill that can stand on its own or enhance any other strategy you use. It teaches you to think like a trader, not just follow signals.
How To Read The Market’s Story In Candlesticks
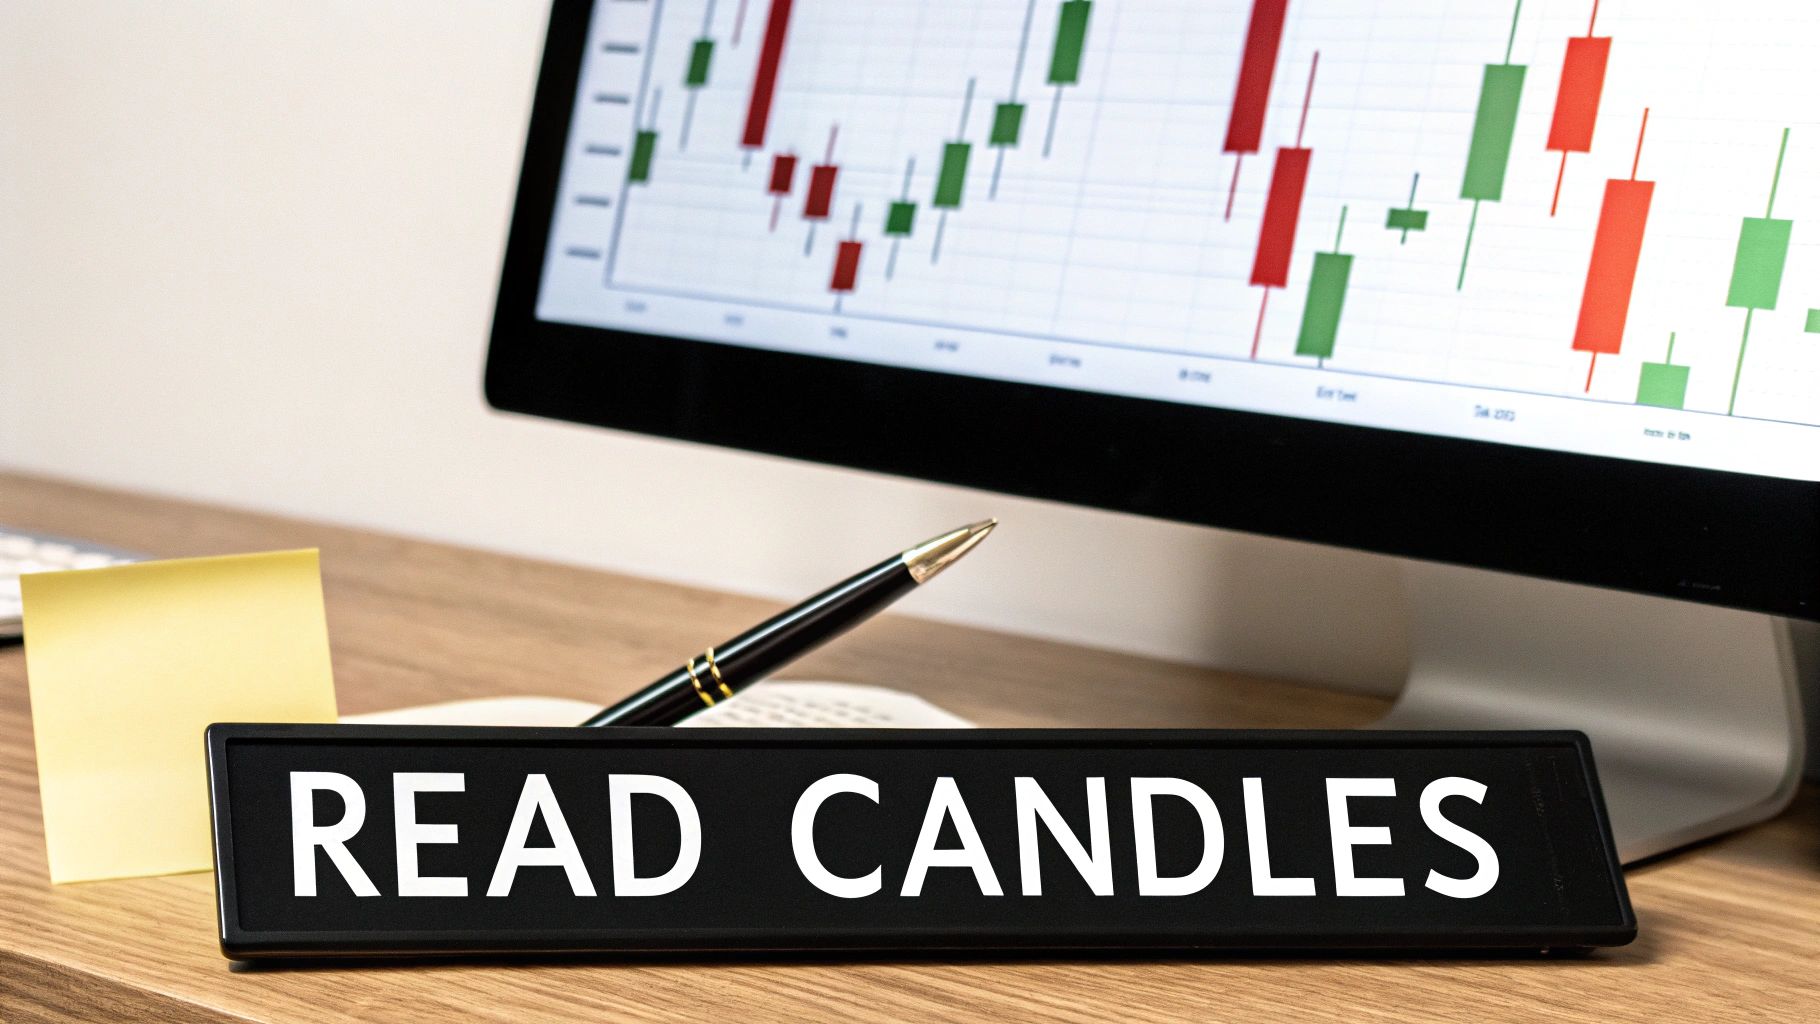
To really master price action trading, you have to learn how to read the market’s language. And that language is written in candlesticks. Each and every candle tells a small but critical story about the constant tug-of-war between buyers (bulls) and sellers (bears) over a specific chunk of time.
Forget about memorizing dozens of weirdly-named patterns. That’s a trap many new traders fall into. Instead, let’s focus on understanding the psychology behind three foundational patterns. Once you get the why behind a pattern, you can read any chart with way more clarity. The goal isn’t to find flawless signals, but to piece together clues about where the market is most likely headed next.
The Pin Bar: A Story of Sharp Rejection
Imagine a stock is trending hard in one direction. It suddenly spikes to a new high or low, only to get violently slammed back by the opposition, closing right back where it started. That’s the entire story of a Pin Bar.
You can spot this pattern easily by its long “wick” (or tail) and tiny body. That long wick is the key — it shows that price tried to go somewhere but was aggressively rejected.
- Bearish Pin Bar: This one has a long wick sticking up. Buyers tried to push the price higher but got steamrolled by sellers, who shoved the price right back down. It’s a potential warning sign that the uptrend is running out of gas.
- Bullish Pin Bar: This has a long wick pointing down. Sellers tried to dump the price lower, but buyers charged in with overwhelming force, driving it back up. This suggests the sellers might be getting exhausted.
A Pin Bar is a powerful visual clue that a turning point could be imminent. It’s basically the market screaming “Nope!” at a certain price, showing a huge shift in momentum just happened.
When you see a Pin Bar form right at a key support or resistance level, it’s an incredibly powerful setup. It adds a ton of weight to the idea that the level is holding strong and a reversal is possible.
The Engulfing Bar: A Story of Total Domination
The Engulfing Bar tells a much different story — one of a sudden and decisive takeover. It happens when one side of the market completely overpowers the other, signaling a powerful potential move in the new direction.
An Engulfing Bar’s body literally swallows, or “engulfs,” the body of the candle right before it. The color is everything here.
- Bullish Engulfing: A big green candle completely wraps around the prior red candle. This shows that buyers not only absorbed all of the previous selling pressure but had enough power left over to push prices even higher. This often signals renewed bullish momentum.
- Bearish Engulfing: A massive red candle completely swallows the prior green one. This pattern shows an aggressive transfer of power to the sellers, often marking a potential top or fueling a downtrend.
This pattern is a big deal because it shows a complete flip in market sentiment in a very short time. The bigger the engulfing candle, the stronger the statement being made.
The Inside Bar: A Story of Indecision and Coiling Energy
Unlike the decisive action of the other two patterns, the Inside Bar tells a story of a pause. It’s a moment of quiet consolidation where the market takes a breath, and both buyers and sellers seem unsure what to do next.
An Inside Bar is simply a candle that is completely contained within the high-and-low range of the candle right before it. It’s a clear sign of contracting volatility.
Think of it like a coiled spring. Energy is building up, but the market hasn’t picked a direction to unleash it yet. This pattern can signal two main things:
- A Potential Continuation: More often than not, the market is just taking a breather before continuing its original trend.
- A Potential Reversal: But sometimes, this pause is the calm before the storm — a precursor to a major reversal as one side secretly builds up strength.
The real signal comes when the price finally breaks out of the range of the “mother bar” (the candle that came before the Inside Bar). A break above signals the bulls are ready to run, while a break below suggests the bears are taking control. With this pattern, it’s less about the bar itself and more about which way the price breaks afterward.
Finding Key Levels With Support And Resistance
You’ve learned to read the story in each candlestick. Now it’s time to map out the battlefield.
Think of the market as having a memory. Certain price levels matter more than others because they’re where big battles between buyers and sellers happened in the past. These key levels are called support and resistance, and they are the foundation of price action trading.
Imagine a ball bouncing in a room. The floor stops it from falling any further — that’s your support level. The ceiling stops it from flying any higher — that’s your resistance level. It’s a simple analogy, but it perfectly captures how traders use these levels to anticipate where the market might turn next.
Support is a price zone where buyers have historically stepped in, overpowering sellers and pushing the price back up. On the flip side, resistance is where sellers have taken control, forcing the price back down. By identifying these zones, you can spot potential turning points with much greater clarity.
How To Draw Support And Resistance Zones
First things first, you need to learn how to spot and draw these levels on your own charts. Forget about trying to draw razor-thin, perfect lines. It’s much more realistic to think of them as zones or areas. Price rarely respects a single, exact price down to the penny.
Here’s a simple way to find them:
- Zoom Out: Start with a higher timeframe chart, like the daily or weekly. This gives you a bird’s-eye view and helps you spot the most significant turning points.
- Look for Swing Points: Find the obvious peaks (swing highs) and valleys (swing lows) where the price clearly reversed. These are your first clues.
- Connect the Dots: Draw a horizontal line or a small rectangle that connects at least two or three of these major swing points. The more times a level has been tested and held, the stronger it is.
And here’s a crucial concept: a level that once acted as support can become resistance if the price breaks below it. This is called a support-resistance flip, and it’s a powerful sign that control has shifted from buyers to sellers.
The Power Of Confluence
Drawing a line on a chart is one thing, but the real magic happens when multiple factors line up at the same key level. We call this confluence, and it dramatically increases the probability of a successful trade. It’s like getting a second, third, and fourth opinion all confirming you’re in the right spot.
Confluence is when a single price level is reinforced by multiple technical factors, creating a potent hot spot for a potential trade. It’s the price action trader’s equivalent of having all the stars align.
For example, imagine a strong horizontal support level that has held up multiple times. As the price pulls back to that exact level, a bullish pin bar forms. Suddenly, you have two powerful signals pointing in the same direction:
- A historically strong support zone.
- A clear candlestick rejection pattern.
This is a high-confluence setup. While nothing in trading is a guarantee, it definitely stacks the odds in your favor. Other factors like trend lines, moving averages, or Fibonacci levels all pointing to the same zone can add even more weight to your setup.
Dynamic Support And Resistance
Support and resistance aren’t always static, horizontal lines. They can also be dynamic support and resistance, moving right along with the price. These are often represented by moving averages, like the 20 or 50-period EMA (Exponential Moving Average).
In a strong uptrend, you’ll often see the price pull back to a key moving average, bounce off it like a dynamic floor, and then continue its move higher.
This is where knowing if the market is trending or consolidating becomes critical. For example, some market analyses show certain indexes spend significant time in consolidation phases. Price action traders often wait for pullbacks to dynamic levels like a key moving average to find high-probability entries within strong trends.
Applying Common Price Action Setups With Trade Examples
Reading charts is one thing, but making real-time decisions when your money is on the line? That’s where the rubber meets the road. It’s time to put all the pieces together — candlesticks, support, and resistance — to build actionable price action trading setups. This is how you translate what you see on the chart into a concrete plan with a clear entry, stop-loss, and target.
We’re going to walk through two of the most reliable setups you’ll see in any market. The point here isn’t to give you a “perfect” system that never fails. Instead, it’s about showing you a disciplined way of thinking so you can spot and manage high-probability opportunities for yourself.
The Pin Bar Reversal At A Key Level
This setup is a true classic, and for good reason. It combines a powerful rejection candlestick (the Pin Bar) with a significant support or resistance zone. When these two elements show up together, they make a very strong case for a potential reversal in the market.
Here’s how you’d think through a trade like this, step-by-step:
- Find Your Context: First, pull up a higher timeframe chart, like the daily, and identify a clear, established level. Has this price been a hard floor (support) or ceiling (resistance) several times before? The more history the level has, the more powerful the setup.
- Wait for the Signal: Patience is everything here. Don’t just set an order at the level and cross your fingers. You have to wait for the price to actually hit that level and give you a clear signal of rejection. In this case, that signal is a textbook Pin Bar with a long wick stabbing into the zone.
- Define Your Entry: A common trigger is to place an order only after the price breaks above the high (for a bullish setup) or below the low (for a bearish one) of the Pin Bar candle. This gives you that final confirmation that momentum is actually shifting in your intended direction.
A crucial reminder: The Pin Bar isn’t the setup. The Pin Bar at a key level is the setup. A random Pin Bar floating in the middle of nowhere means very little. Context is king.
The Breakout And Retest Strategy
Of course, markets don’t always turn around at key levels. Sometimes, they build up enough steam to blast right through them. The “Breakout and Retest” is a fantastic continuation strategy that lets you hop on a new trend just after it’s proven its strength.
The psychology behind it is simple. A level that was once a ceiling (resistance) now becomes a new floor (support) after a breakout, or vice versa. Traders who were hesitant to buy the initial breakout are often waiting for the price to pull back and “retest” this old level, seeing it as a second chance to get in on the move.
Here’s how to play it:
- Spot the Breakout: Look for a strong, decisive move that clearly closes above resistance or below support. A spike in volume on the breakout candle is a great sign that it’s the real deal.
- Wait Patiently for the Retest: This is the hard part, and where most new traders get burned. They chase the initial spike and get stopped out on the pullback. A disciplined trader waits for the price to come back to the level it just broke.
- Look for an Entry Signal: As the price pulls back and tests the old level, look for a price action signal — like a small pin bar or an engulfing pattern — to confirm the level is holding. That’s your cue to enter in the direction of the breakout.
Before you can even think about setups, you have to know what the market is doing. This simple decision tree gives you a quick framework for classifying the current trend.
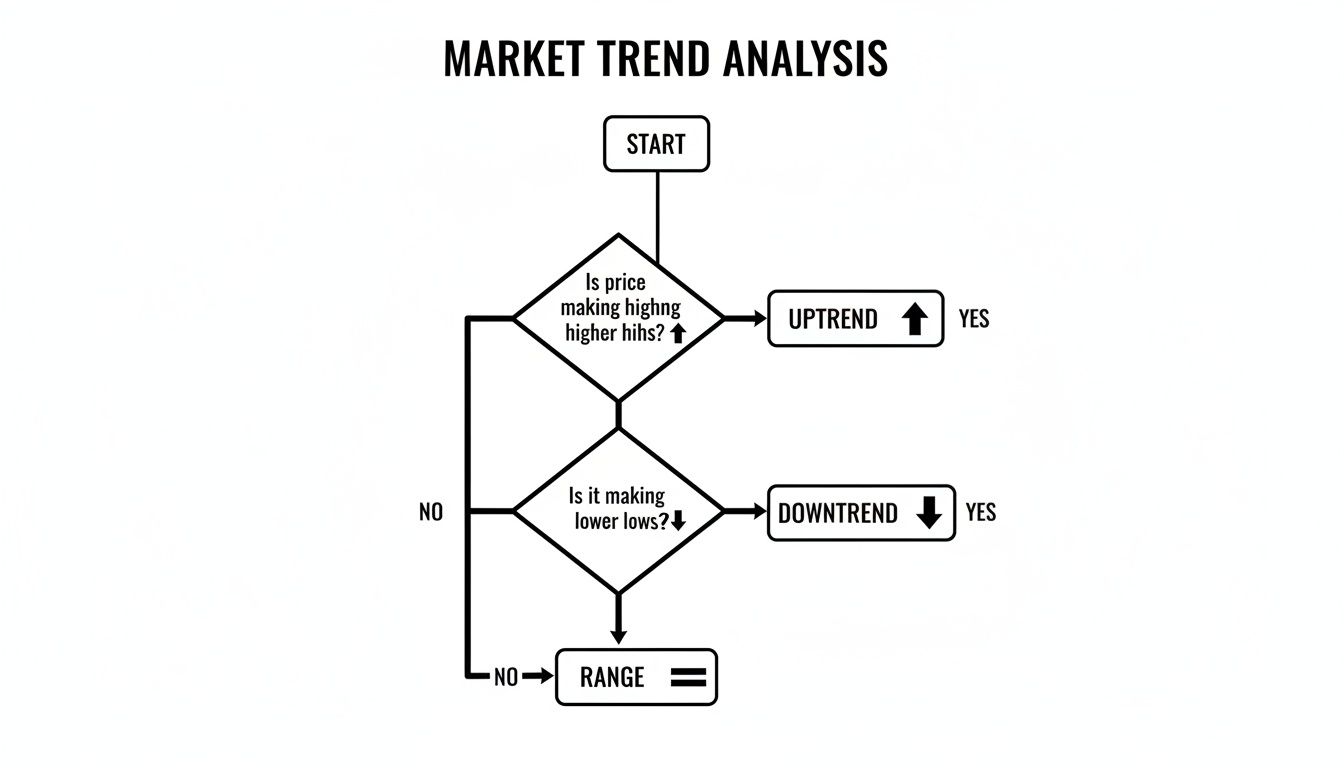
This visual boils trend analysis down to its core: is the price making new highs or new lows? Everything in price action trading starts from this fundamental question.
Price action is especially good at navigating the tricky business of pullbacks and failed breakouts. In certain markets, “failed breakouts” are a common pattern. In a strong downtrend, a bearish “fakey” pattern — which is essentially a false breakout from a range — can be a high-probability signal for a short entry.
This is where a good journal like TradeReview becomes invaluable. You can tag trades with multiple points of confluence, like a “pin bar” that also formed at a “50% retracement” and on “horizontal support.” To dive deeper into these strategies, you can read more on price action strategies.
Mastering Your Mind With Risk And Money Management
You can find the absolute perfect price action setup, but without discipline and a rock-solid risk management plan, you’re just gambling. This is the part of trading that isn’t glamorous, but it’s the one thing that separates consistent traders from those who inevitably blow up their accounts.
It’s a tough lesson many of us have learned the hard way. We’ve all been there — watching a trade move against us, just hoping it will turn around, only to see a small, manageable loss spiral into a devastating one. Greed and fear are powerful forces that can hijack even the most well-thought-out trading plan.
The secret to long-term survival in price action trading isn’t some hidden strategy; it’s about building a professional mindset through a set of non-negotiable rules. These rules act as your guardrails, protecting you from your own worst impulses. They turn emotional, gut-wrenching decisions into simple, mechanical actions, preserving your capital so you can stay in the game long enough to find your edge.
Your Non-Negotiable Trading Rules
To really build that professional mindset, you need to lock in a few career-saving habits. These aren’t just suggestions; they’re the absolute pillars of responsible trading that prevent you from making catastrophic mistakes.
Here are three rules every price action trader should live by:
- Always Use a Stop-Loss: Every single trade needs a pre-determined exit point if things go south. This is your insurance policy. Without it, you’re flying blind with unlimited risk.
- Calculate Position Size Correctly: Never risk more than a small, fixed percentage of your account on a single trade — typically 1-2%. This simple rule prevents one bad trade from ever wiping you out.
- Evaluate Risk-to-Reward: Only take trades where the potential reward is significantly greater than the potential loss. A common minimum is a 1:2 risk-to-reward ratio, meaning you aim to make at least twice what you stand to lose.
Risk management isn’t about trying to predict the future. It’s about fully accepting that you can be wrong and ensuring that when you are, the damage is small and completely manageable.
A Simple Guide To Position Sizing
So how do you actually apply the “risk 1% of your account” rule? That’s where position sizing comes in. It’s the formula that tells you exactly how many shares or contracts to trade based on where your stop-loss is.
Let’s walk through a quick, practical example:
- Account Balance: Let’s say you have a $10,000 trading account.
- Maximum Risk Per Trade: You’ve committed to risking 1% of your account on any single trade. That means your maximum acceptable loss is $100 ($10,000 x 0.01).
- Identify Your Setup: You spot a bullish pin bar at a key support level on Stock ABC, which is currently trading at $50.
- Set Your Stop-Loss: You place your stop-loss just below the low of that pin bar, at $48. The distance between your entry price ($50) and your stop ($48) is $2 per share. This is your “risk per share.”
- Calculate Your Position Size: Now, just divide your maximum risk ($100) by your risk per share ($2). The result is 50 shares.
This simple math ensures that if the trade hits your stop-loss, you will lose exactly $100 — your planned 1% risk. No more, no less. You can dive deeper into these concepts in our detailed guide on risk management for traders.
This methodical approach isn’t just about discipline; it’s about playing the long game. Trading is a marathon, not a sprint. By protecting your capital with smart sizing, you ensure you’ll be around to trade tomorrow, next week, and next year.
How To Journal And Analyze Your Price Action Trades
Here’s a hard truth: even the best price action trading setups can and will fail. What separates a professional from an amateur isn’t a perfect win rate — it’s what happens after a trade closes. Pros treat trading like a business, and meticulous record-keeping is the backbone of that business. Without it, you’re just gambling.
A trading journal is what turns your raw, gut-feel experiences into objective data you can actually use. It helps you shift from making emotional decisions based on your last big win to making data-driven choices based on what truly works for your unique trading style. This is how you stop repeating the same frustrating mistakes and start building real, lasting consistency.
From Guesswork To A Data-Driven Business
The point of a journal isn’t just to log wins and losses. It’s to get clear, objective answers to the questions that truly define your performance. A purpose-built tool like TradeReview is designed to do exactly that by tracking the right data points and giving you analytics that make sense.
You can finally get concrete answers to questions like:
- Which specific price action setup is making me the most money?
- Do I make better trades when the market is trending or when it’s stuck in a range?
- Am I consistently cutting my winners short or letting my losers run way too long?
Think of your trading journal as your personal performance coach. It holds you accountable, shows you where you’re strong, and shines a bright, unflinching light on the habits that are costing you money.
This entire process is what transforms hope into a measurable edge. By systematically analyzing your trades, you can confidently double down on what works and ruthlessly cut out what doesn’t.
A Practical Journaling Workflow
To get started, you need to capture the right information for every single trade. Consistency is everything. Over time, these data points will paint a powerful and honest picture of your trading habits. You can dive deeper into the fundamentals in our article explaining why every trader needs a trading journal.
Here’s a simple but incredibly effective workflow for every price action trade you take:
-
Capture the “Before” Screenshot: Before you even think about clicking “buy” or “sell,” take a screenshot of the clean chart. Mark up the setup you see (e.g., pin bar at resistance) and your planned entry, stop-loss, and target. This captures your honest analysis, free from hindsight bias.
-
Log the “Why”: In your journal, write down exactly why you’re taking this trade. Was it a setup with multiple confirming signals? What was the overall market context? This simple step forces you to trade with clear intention.
-
Record Your Emotional State: Be brutally honest here. Were you feeling patient and calm, or were you feeling fearful, greedy, or impatient? This often reveals hidden patterns, like a tendency to take impulsive trades right after a big loss.
-
Capture the “After” Screenshot: Once the trade is closed — win or lose — take another screenshot showing how it all played out. Mark your actual entry and exit points. This visual feedback is one of the most powerful ways to review your execution.
-
Tag Everything: Use flexible tags to categorize every aspect of the trade. Create tags for your setups (
pin_bar,breakout_retest), market conditions (trending,ranging), and even your psychological mistakes (fomo_entry,moved_stop).
After a while, you can start filtering your journal by these tags. You might discover that your pin_bar trades in trending markets have a 70% win rate, but your breakout_retest trades in ranging markets are consistent losers. An insight like that, backed by your own data, is exactly how you build a profitable trading career.
Common Questions About Price Action Trading
Even after you’ve got the basics down, a few questions always pop up when traders start applying price action in the real world. Let’s tackle some of the most common ones to clear things up and help you trade with more confidence.
Is Price Action Trading a Good Fit for Beginners?
Yes, but it comes with a catch: you have to be dedicated. While price action declutters your charts by removing indicators, it asks for something else in return — screen time. A lot of it. You have to put in the hours to really learn how to read the story the chart is telling you. It’s a skill that builds slowly, with practice and patience.
For new traders, the key is to not get overwhelmed. Don’t try to trade every pattern you learn about. Instead, pick one or two simple, high-probability setups and just focus on mastering those. Discipline is everything here. Think of it less as a shortcut to making money and more as building a foundational skill that will serve you for your entire trading career. A demo account is an excellent tool for this — it’s the perfect sandbox to practice spotting patterns and levels without risking a dime.
Can You Mix Indicators with Price Action?
Absolutely. In fact, many professional traders do exactly this. The trick is to always let price be the star of the show. Your indicators should play a supporting role, not the lead.
Here’s a practical example: you might use a 20-period EMA to get a quick read on the trend. If the price is trading above it, you know the momentum is generally bullish. Then, you spot a perfect bullish pin bar forming right as the price pulls back and touches that EMA. That’s a beautiful confluence — the indicator confirms what the price action is already hinting at, giving you a much stronger signal for the trade.
The goal is to use indicators to support what the price is already telling you, not to let them dictate your trades or contradict clear price signals.
What’s the Best Timeframe for Price Action Trading?
This is a great question because price action is fractal — it works on every timeframe, from the one-minute all the way up to the weekly. That said, the higher timeframes, like the 4-hour and daily charts, tend to produce more reliable signals. Why? Because they filter out a ton of the random “noise” you see on lower timeframes.
If you’re just starting out, it’s often helpful to stick to these higher timeframes. The pace is slower, which gives you more time to analyze the chart and make a thoughtful decision. It’s a fantastic way to build patience and discipline right from the start, preventing the pressure of making snap judgments that often trips up new traders.
Ready to stop guessing and start treating your trading like a business? The first step is tracking your data. Start logging your trades with TradeReview to analyze your performance, pinpoint your most profitable setups, and build the consistency you’ve been looking for. Create your free journal today.


