The journey to consistent trading isn’t about finding a single ‘holy grail’ indicator or a setup promising guaranteed profits. It’s about building a systematic, repeatable approach that aligns with your personality, risk tolerance, and lifestyle. We understand the frustration many traders face: a series of promising wins completely wiped out by one or two undisciplined, emotional trades. The critical difference between long-term success and failure often comes down to having a defined plan and the discipline to stick to it.
This article moves beyond pure theory to provide a practical, comprehensive roundup of 10 great trading strategies. We will break down each methodology into its core components, including clear entry and exit criteria, risk-management rules, and practical trade examples. Whether you are a long-term investor accumulating assets, a swing trader capturing multi-day moves, or a day trader capitalizing on intraday volatility, the goal is to find a framework you can test, refine, and execute with unwavering discipline.
We’ll cover a diverse range of approaches — from Momentum and Trend Following to Mean Reversion and Options Income strategies. For each one, we will emphasize the importance of meticulous record-keeping. Using a dedicated trading journal is non-negotiable for serious traders. It is the only way to objectively analyze your performance, identify what truly works for your style, and cultivate the data-driven mindset required to navigate the markets effectively. This guide is your blueprint for moving from random guesswork to a structured, professional process.
1. Momentum Trading
Momentum trading is one of the great trading strategies built on a simple premise: assets in motion tend to stay in motion. Instead of buying low and selling high, momentum traders buy high and aim to sell higher, capitalizing on the continuation of existing market trends. The core idea is to identify stocks or other assets demonstrating strong upward or downward price velocity and ride that trend until signs of reversal appear. This approach assumes that market sentiment and institutional flows driving a trend will persist for a certain period.
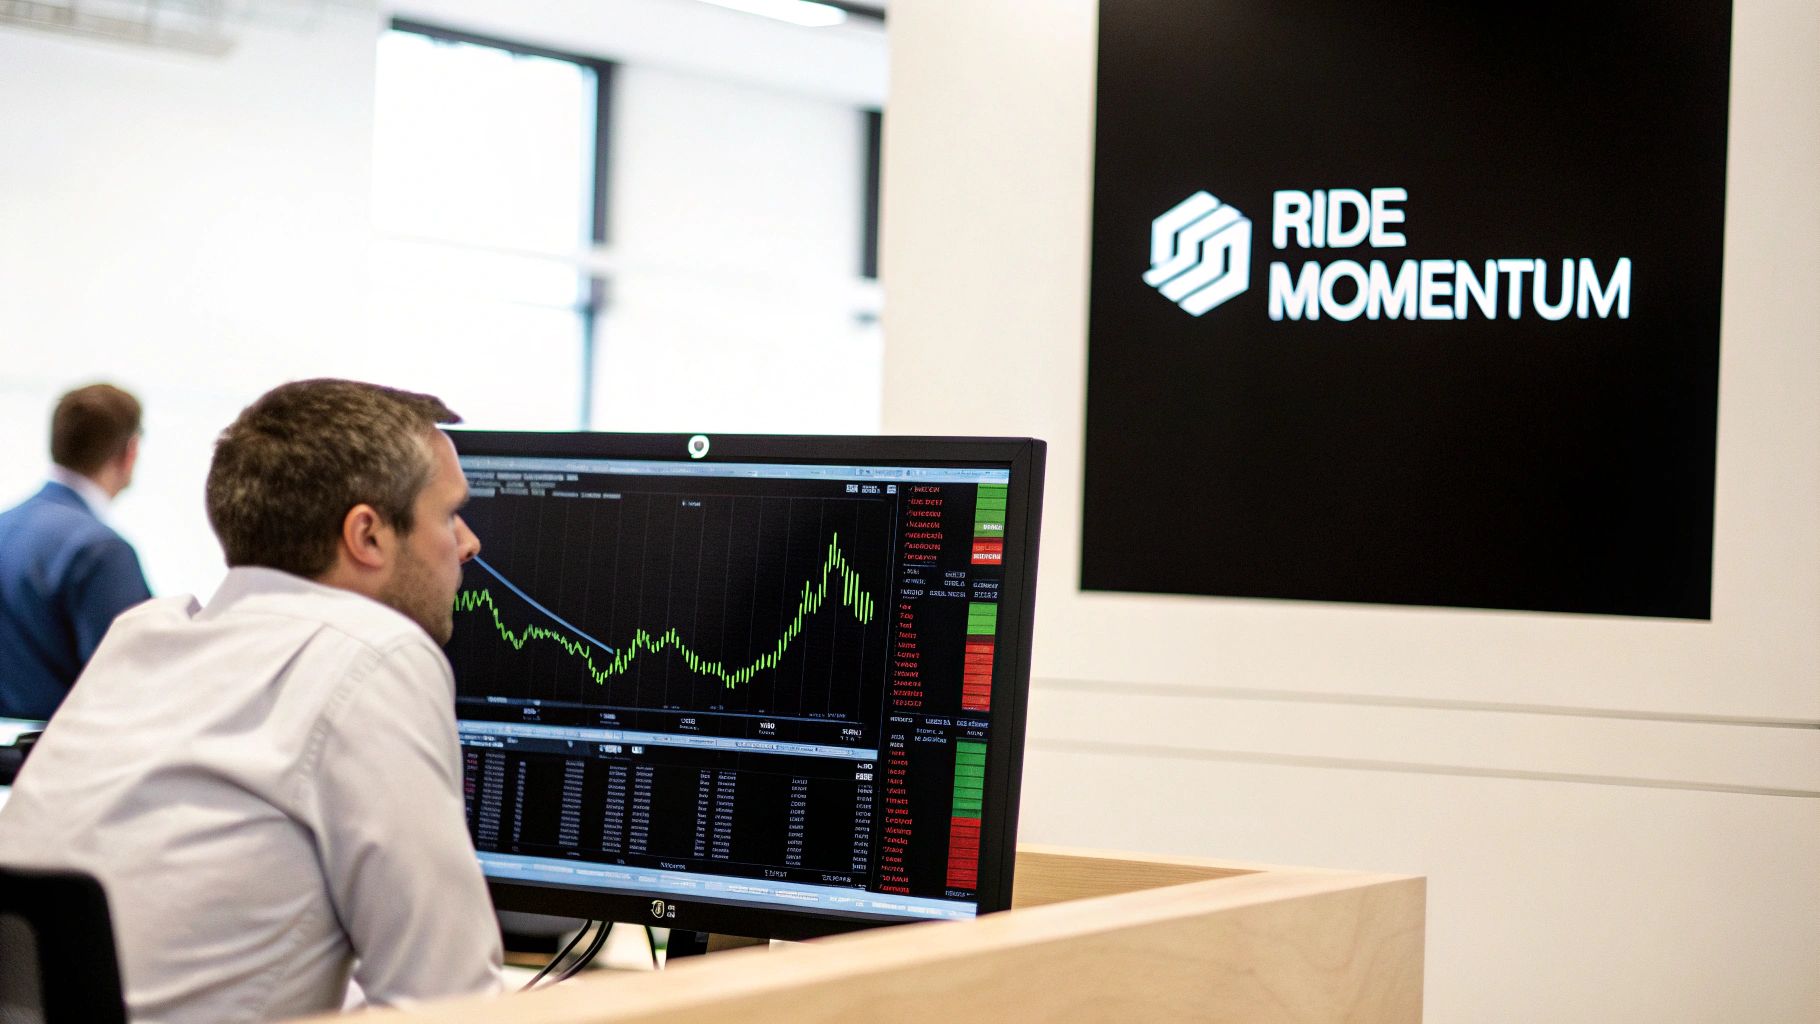
This strategy relies heavily on technical analysis. Traders look for assets breaking out to new highs (like 52-week highs) on significant volume, as this often signals strong institutional interest.
How to Implement Momentum Trading
A practical example is identifying a stock that has just reported strong earnings and positive forward guidance. Imagine a company surpasses analyst expectations, causing its stock to gap up 10% on volume that is five times its daily average. A momentum trader might enter a long position shortly after the market opens, aiming to capture the subsequent upward drift as more investors and algorithms pile in. The exit strategy is just as crucial: the position is closed when momentum indicators — such as the Relative Strength Index (RSI) showing overbought conditions or a significant drop in volume — suggest the trend is losing steam.
Key Insight: Success in momentum trading isn’t just about finding fast-moving stocks. It’s about disciplined risk management. A strong trend can reverse sharply, making pre-defined stop-losses essential to protect your capital.
Tracking and Optimizing with TradeReview
Effectively managing a momentum strategy requires rigorous analysis to see what’s working.
- Indicator Analysis: Use TradeReview’s Performance Analytics to determine which momentum indicators (like RSI or MACD) provide the most reliable signals for your chosen assets.
- Condition Tagging: Create a specific tag for “Momentum Trades” in your journal. This allows you to analyze your win rate and profitability specifically during high-momentum market phases versus choppy, range-bound conditions.
- Automated Logging: By syncing your broker account, TradeReview can automatically log your entries and exits. This helps you objectively compare your planned exit, based on fading momentum, against your actual exit, revealing any emotional decision-making.
2. Mean Reversion
In direct contrast to momentum, mean reversion is one of the great trading strategies built on the statistical premise that asset prices and historical returns eventually revert to their long-term average. The core concept is that extreme price movements are often temporary. Traders using this strategy identify overextended assets — whether overbought or oversold — and place trades anticipating a return to a baseline, or “mean.” This approach thrives in range-bound or sideways markets where trends are absent.
This strategy uses statistical tools like standard deviations and moving averages to pinpoint entry opportunities. The key is to identify when a price has stretched too far from its average, much like a rubber band, creating a high-probability setup for it to snap back.
How to Implement Mean Reversion
A common example involves trading a highly liquid ETF like the SPDR S&P 500 ETF (SPY). A trader might define the “mean” as the 20-day simple moving average (SMA). If SPY’s price drops significantly below this average — for instance, moving more than two standard deviations away, a level indicated by Bollinger Bands — it signals an oversold condition. The mean reversion trader would enter a long position, betting on a bounce back toward the 20-day SMA. The exit would be triggered as the price approaches the moving average or if it continues to fall past a predetermined stop-loss.
Key Insight: The greatest risk in mean reversion is mistaking the beginning of a powerful new trend for a temporary overextension. A strategy that works well in a ranging market can be severely damaged by one strong, trending move. This is why strict risk management is crucial.
Tracking and Optimizing with TradeReview
To succeed with mean reversion, you must know when the strategy is effective and when to stand aside.
- Market Condition Tagging: Use TradeReview’s flexible tagging to create tags like “Ranging Market” and “Trending Market.” By analyzing your performance under each tag, you can see precisely when your mean reversion setups are most profitable.
- Performance Analysis: Track your win rate and profit factor specifically for mean reversion trades. If you notice performance degrading, it could be a sign that the overall market character has shifted from range-bound to trending, signaling a time to pause the strategy.
- Log Key Levels: In your trade notes, log the specific support or resistance levels and the moving average you traded against. Over time, this creates a data-rich playbook for identifying the most reliable reversion patterns for your chosen assets.
3. Trend Following
Trend following is a robust trading strategy designed to capitalize on long-term directional movements in the market. Unlike short-term strategies, trend followers aim to capture the bulk of major market trends — whether up or down — by holding positions for weeks, months, or even longer. The core philosophy is to let profits run and cut losses short, entering a trade once a trend has been established and exiting only when it shows definitive signs of reversal. This systematic approach is applicable across various asset classes, from stocks and commodities to currencies.
This method is less about predicting market tops and bottoms and more about reacting to what the market is actually doing. It relies on indicators like moving averages or price channels to confirm a trend’s existence and strength, helping to remove emotion from the decision-making process.
How to Implement Trend Following
A classic example of trend following would be identifying a new bull market in a commodity like gold. Imagine gold breaks above a key long-term resistance level, and its 50-day moving average crosses above its 200-day moving average (a “golden cross”). A trend follower would enter a long position and hold it as the price continues to rise over the following months. The exit would be triggered not by a small pullback, but by a clear reversal signal, such as the price breaking decisively below a long-term moving average like the 100-day SMA.
Key Insight: Trend following requires immense patience and discipline. The strategy often involves enduring multiple small losses while waiting for the one large, profitable trend that can define a portfolio’s performance for the year. The emotional challenge is staying in a winning trade and not taking profits too early.
Tracking and Optimizing with TradeReview
Successfully managing a long-term trend-following approach requires a clear view of your performance over extended periods.
- Duration Analysis: Sync your broker account to automatically log your trades. Use TradeReview’s analytics to track the average duration of your winning trend trades versus your losing ones, ensuring you are holding winners long enough.
- Condition Tagging: Create specific tags like “Early Trend,” “Mid Trend,” and “Late Trend” to analyze the profitability of your entry timing. This helps you determine if you are better at catching trends early or joining them once established.
- Performance Metrics: Use your dashboard to monitor the profit factor specifically for your trend-following system. Compare this against other strategies you might employ, such as mean reversion, to understand where your strengths lie.
4. Breakout Trading
Breakout trading is one of the most dynamic and great trading strategies, focusing on capturing powerful price moves that occur when an asset breaks through a key level of support or resistance. The core concept is to enter a trade just as the price “breaks out” of a defined range or pattern, with the expectation that the newfound momentum will carry the price significantly further in the same direction. This strategy hinges on the idea that these key levels represent a psychological battleground between buyers and sellers, and a breakout signals a decisive victory for one side.
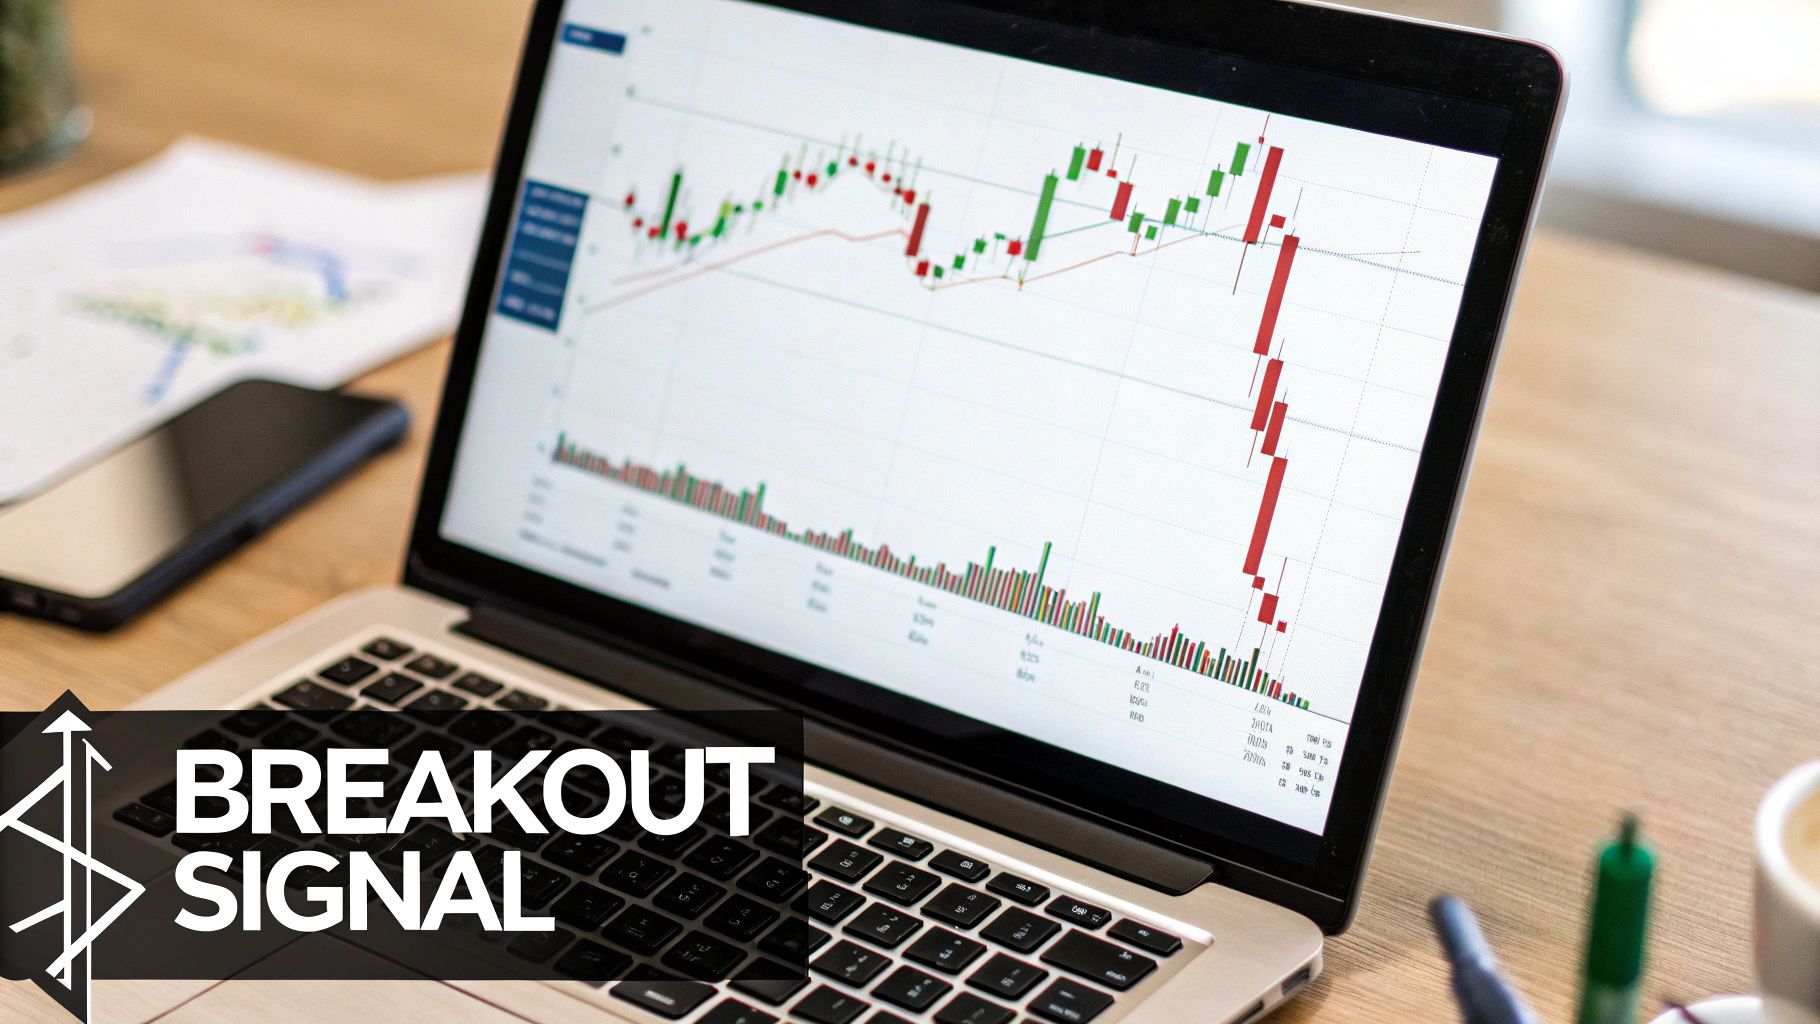
This approach relies heavily on price action and volume analysis. A breakout accompanied by a significant spike in volume is considered a much more reliable signal, suggesting strong institutional conviction behind the move.
How to Implement Breakout Trading
A classic example involves trading a stock that has been consolidating in a tight range for several weeks, often called a “base.” Suppose a tech stock has been trading between $150 (support) and $160 (resistance). A breakout trader would place an alert at the $160 level. If the stock price pushes above $160 on unusually high volume, the trader enters a long position, anticipating a rapid move higher. The initial stop-loss would typically be placed just below the breakout level, at around $159, to protect against a “false breakout” where the price quickly reverses.
Key Insight: The biggest challenge in breakout trading is distinguishing between genuine breakouts and “fakeouts.” Many traders find that confirming a breakout with a surge in volume is one of the most effective ways to filter out low-probability trades and avoid getting trapped.
Tracking and Optimizing with TradeReview
Disciplined tracking is essential to mastering breakout setups, and a trading journal provides the necessary data.
- Trade Categorization: Use TradeReview’s tagging system to create distinct tags for “Successful Breakouts” and “False Breakouts.” Over time, this helps you analyze the specific market conditions, times of day, or volume patterns that lead to winning trades.
- Performance Analytics: In your trade notes, log the relative volume at the time of the breakout. You can then use the performance analytics to correlate high-volume breakouts with your profitability, validating the importance of this confirmation signal.
- Calendar View Analysis: Use the calendar view to identify if your most successful breakouts occur during specific times, such as the market open or following major economic news releases.
5. Swing Trading
Swing trading is one of the most popular great trading strategies, designed to capture price “swings” that occur over a period of a few days to several weeks. Unlike day traders who close positions daily, swing traders hold their trades overnight or longer to capitalize on larger market moves. The goal is to identify a potential price move, enter the trade, and exit once the move has run its course, without getting caught in long-term, trendless consolidations. This approach sits comfortably between the high-frequency nature of day trading and the long-term commitment of trend following.
Swing trading often relies on analyzing price charts to find patterns, support and resistance levels, and key moving averages. The strategy aims to catch a portion of a larger trend, such as buying a pullback within a confirmed uptrend or shorting a rally within a downtrend.
How to Implement Swing Trading
A classic swing trade setup involves identifying a stock in a strong uptrend that has temporarily pulled back to a key support level, such as the 50-day moving average. For example, a trader notices that a well-known stock is in a clear uptrend but has pulled back over three days to its 50-day moving average (MA). Seeing a bullish candlestick pattern form at this level, the trader enters a long position. The plan is to hold the position for the next one to two weeks, with a price target near the previous high and a stop-loss just below the 50-day MA. The trade is closed once the target is hit or if the trend shows signs of reversal.
Key Insight: Patience is paramount in swing trading. The strategy requires waiting for a high-probability setup to form rather than forcing trades, and it demands the discipline to hold through minor daily fluctuations without panic. The real work is often done during market-off hours, scanning and preparing for the next opportunity.
Tracking and Optimizing with TradeReview
Effective swing trading hinges on analyzing your holding periods and setup quality.
- Trade Duration Analysis: Use TradeReview’s dashboard to monitor the holding period of your trades. This can reveal your optimal holding time, helping you determine if you are closing winning trades too early or holding losing trades too long.
- Condition Tagging: Create tags like “Pullback to 50MA” or “Breakout Consolidation” to track the performance of your specific setups. This data will show which swing trading patterns are most profitable for your style.
- Trade Notes for Gaps: Use the journaling feature to log how overnight gaps affect your positions. By noting whether a gap helped or hurt your trade, you can identify patterns related to earnings season or market news that influence your strategy’s effectiveness.
6. Options Income / Premium Selling
Unlike strategies that rely on predicting the correct direction of a price move, options income strategies focus on generating consistent cash flow by selling options premium. The core principle is that most options expire worthless, allowing sellers to profit from time decay (theta). This is one of the great trading strategies for those seeking recurring income rather than chasing large, directional wins. The goal is to collect premium and let time work in your favor as the option’s value erodes.
This approach treats trading like an insurance business: you sell policies (options contracts) and collect premiums, managing risk to ensure payouts are less than the income received over time. It emphasizes a high probability of profit on each trade, even if the individual gains are smaller.
How to Implement Options Income / Premium Selling
A common example is selling a cash-secured put on a high-quality stock you wouldn’t mind owning. Imagine you believe a stock is fairly valued at $190 per share, but it’s currently trading at $200. You could sell a put option with a $190 strike price that expires in 30 days and collect a premium. If the stock stays above $190 by expiration, you keep the entire premium. If it drops below, you are obligated to buy the shares at your desired price of $190, with your net cost reduced by the premium you collected. Another strategy is selling covered calls on existing stock positions to generate extra income.
Key Insight: The primary risk in premium selling is not a small loss, but an outsized, unmanaged one. A sudden, sharp move against your position can wipe out many small gains, making diligent risk management techniques absolutely essential.
Tracking and Optimizing with TradeReview
Consistency is key for an income strategy, and detailed tracking is the only way to achieve it.
- Premium Collection Analysis: Create a custom tag like “Options Income” to isolate these trades. Use your analytics to calculate your average monthly premium collected and your realized win rate, ensuring your strategy is performing as expected.
- Greeks Post-Analysis: In your TradeReview journal notes, log the key Greeks (Delta, Theta, Vega) at the time of entry. This allows you to review trades and see how changes in implied volatility or the underlying price impacted your P/L relative to time decay.
- Expiration Management: Utilize the calendar view to get a clear visual of all your upcoming expiration dates. This helps you proactively manage positions by rolling, closing, or preparing for potential assignment without being caught by surprise.
7. Statistical Arbitrage / Pairs Trading
Statistical arbitrage is one of the more quantitative great trading strategies, designed to exploit temporary pricing inefficiencies between two or more historically correlated assets. Known as pairs trading in its simplest form, the strategy involves identifying two assets whose prices typically move together. When their prices diverge from their normal relationship, traders simultaneously buy the underperforming asset and short-sell the outperforming one, betting on their eventual reconvergence. This market-neutral approach aims to generate profit regardless of the overall market’s direction.
This strategy builds on the idea that historical relationships will, on average, hold true over time. It requires a strong understanding of statistics, correlation, and cointegration (a statistical property of time-series data) to identify legitimate trading opportunities and avoid “broken” pairs where the fundamental relationship has permanently changed.
How to Implement Statistical Arbitrage
A classic example is pairing two competitors in the same industry, like Coca-Cola (KO) and PepsiCo (PEP). If these stocks have a strong historical correlation but PEP temporarily rallies much harder than KO without a clear fundamental reason, a trader might short PEP and go long KO. The profit is realized when the price spread between them narrows back to its historical mean. Similarly, a trader might pair a gold ETF (GLD) with a gold miners ETF (GDX), betting on the reversion of their typical performance ratio.
Key Insight: The biggest risk in pairs trading is a fundamental breakdown in the assets’ relationship. A seemingly temporary divergence could be the start of a new, permanent trend, leading to significant losses on both legs of the trade. Rigorous backtesting and real-time monitoring are essential.
Tracking and Optimizing with TradeReview
Managing the two sides of a pairs trade requires precise tracking to monitor the spread.
- Pair Tagging: Create a specific tag in your journal for each pair (e.g., “KO/PEP Pair”). This lets you analyze the profitability and performance of each specific pairing strategy over time.
- Spread Monitoring: By logging both legs of the trade, you can use TradeReview’s dashboard to monitor the combined P&L of the pair. This provides an at-a-glance view of the spread’s performance, helping you identify when to take profits or cut losses.
- Quantitative Notes: Use the notes section to log the specific quantitative triggers for your entry, such as the standard deviation level of the price spread. This data is invaluable for refining your model and understanding what statistical thresholds work best. Due to its quantitative nature, this strategy often benefits from automation; you can learn more about algorithmic trading here.
8. Earnings Play / Catalyst Trading
Catalyst trading is one of the more event-driven great trading strategies, focusing on opportunities around specific news events. Instead of relying solely on technical trends, traders take positions in anticipation of market-moving announcements such as corporate earnings reports, FDA approval decisions, or major economic data releases. The goal is to capitalize on the expected price swing or the expansion in implied volatility (IV) that often precedes these events.
This strategy is particularly popular among options traders, who can use instruments like straddles or strangles to bet on a large move without needing to predict the exact direction. The core principle is that known future events create temporary, predictable inefficiencies and opportunities that a prepared trader can exploit.
How to Implement Catalyst Trading
A classic example is trading a major tech company’s earnings report. Imagine a company is set to announce its quarterly results. A trader expecting a significant price move, regardless of direction, could buy a long straddle by purchasing both a call and a put option with the same strike price and expiration date. If the stock makes a large move up or down after the announcement, the profit from one leg of the trade is designed to outweigh the cost of both options contracts. The key is for the stock’s move to be larger than the premium paid.
Key Insight: The biggest challenge in catalyst trading is “IV crush,” where implied volatility collapses after the event occurs. A successful trade requires the stock’s price move to be substantial enough to overcome this rapid drop in option value. This is a known risk that must be factored into every trade.
Tracking and Optimizing with TradeReview
Disciplined analysis is crucial for refining a catalyst-based strategy and avoiding common pitfalls.
- Event Tagging: Create specific tags in your journal like “Earnings Play,” “FDA Decision,” or “Fed Meeting.” This allows you to isolate these trades and analyze their unique performance metrics, such as win rate and average profit/loss, compared to your baseline strategies.
- Volatility Analysis: Use TradeReview’s note-taking feature to log the implied volatility (IV) level at both entry and exit for each catalyst trade. Over time, you can analyze this data to determine the optimal IV environments for entering and exiting your positions.
- Calendar View: Leverage the Calendar View to map your open positions against upcoming catalyst dates. This visual tool helps you manage risk by ensuring you are aware of all event-driven volatility that could impact your portfolio.
9. Dollar-Cost Averaging (DCA) / Accumulation
Dollar-Cost Averaging (DCA) is less of a trading tactic and more of a disciplined, long-term investment strategy. It involves investing a fixed amount of money into a particular asset at regular intervals, regardless of its price. Instead of trying to time the market by buying at the absolute bottom, an accumulator using DCA buys consistently, whether the market is up, down, or sideways. The core principle is that this systematic approach mitigates the risk of making a large investment at a market peak and smooths out the average purchase price over time.
DCA is designed to remove emotion from the investment process. By automating contributions, investors avoid the twin pitfalls of fear-driven selling during downturns and greed-driven buying during speculative bubbles. It turns market volatility from an enemy into an ally, as price dips allow you to acquire more shares for the same fixed investment.
How to Implement Dollar-Cost Averaging
A classic example is an investor committing to buy $500 worth of an S&P 500 index fund on the first day of every month. If the fund is trading at $500, they get one share. If it dips to $450 the next month, their $500 buys approximately 1.11 shares. Over years, this consistency builds a position at an attractive average cost. The same principle applies to a 401(k) plan, where contributions are automatically deducted from each paycheck, or a crypto investor buying $100 of Bitcoin every Friday.
Key Insight: DCA is a strategy of patience and discipline. Its power isn’t in generating quick profits but in systematically building wealth over a long horizon by leveraging time and compounding. It is a commitment to a process, not a prediction of a price.
Tracking and Optimizing with TradeReview
While DCA is often automated, tracking its effectiveness is crucial for long-term goal alignment.
- Schedule and Cost Basis: Use TradeReview’s Cash Tracking feature to log each periodic deposit and purchase. This helps you stick to your schedule and clearly visualizes your average cost basis against the asset’s current market value.
- Condition Tagging: Tag every automated purchase with “DCA” or “Accumulation.” This allows you to run reports that isolate the performance of this strategy and compare its long-term return against benchmarks or other strategies you might employ.
- Portfolio Growth: The dashboard provides a clear overview of your portfolio’s accumulation over time. This visual feedback helps reinforce the discipline required for DCA, especially during market downturns when it might be tempting to stop investing.
10. Technical Analysis / Price Action Trading
Price action trading is one of the most fundamental and great trading strategies, focusing solely on the movement of an asset’s price over time. Traders who use this approach strip their charts of most, if not all, indicators like RSI or MACD. Instead, they learn to interpret the “story” the price is telling through candlestick patterns, chart formations, and key support and resistance levels. The core belief is that all necessary information about market sentiment and potential future direction is already reflected in the price itself.

This method requires a deep understanding of market structure. By identifying areas of institutional buying (demand zones) and selling (supply zones), traders can make highly intuitive and adaptable decisions. This pure approach helps avoid the paralysis that can come from conflicting indicator signals, promoting a cleaner, more direct trading style.
How to Implement Price Action Trading
A common price action setup is a pin bar reversal at a key support level. For example, imagine the S&P 500 ETF (SPY) has sold off to a previous major low where it found buyers before. A trader observes a candlestick forming a long lower wick (the “pin”), indicating that buyers stepped in aggressively to reject lower prices. A price action trader might enter a long position above the high of that pin bar, placing a stop-loss just below its low, anticipating a bounce. Success requires patience to wait for these high-probability setups to form at significant price levels.
Key Insight: Price action is not about predicting the future with certainty; it’s about identifying where the risk-to-reward is skewed in your favor based on historical price behavior. It is a skill of observation and reaction, not forecasting.
Tracking and Optimizing with TradeReview
Mastering price action requires meticulous record-keeping and pattern recognition.
- Pattern Tagging: Create tags in your journal for specific setups like “Pin Bar Reversal,” “Inside Bar Breakout,” or “H&S Pattern.” This allows you to analyze the win rate and profitability of each pattern you trade.
- Chart Annotations: Use TradeReview’s notes section to attach screenshots of your chart analysis before you enter a trade. This creates an objective record you can review later to see if you correctly identified the pattern.
- Performance by Asset: By filtering your analytics, you can determine which price action setups work best for specific assets. You might find that inside bars perform well on forex pairs while supply/demand bounces are more reliable for indices.
Top 10 Trading Strategies Comparison
| Strategy | 🔄 Implementation complexity | ⚡ Resource requirements / efficiency | ⭐ Expected outcomes / quality | 📊 Ideal use cases | 💡 Key advantages / tips |
|---|---|---|---|---|---|
| Momentum Trading | Medium–High: real-time screens, indicator setup, active trade management | High: fast execution, data/volume feeds, capital for volatile names | ⭐⭐⭐ Quick profits during trends; higher variance and drawdown risk | Day traders & swing traders targeting high-liquidity movers | 💡 Use RSI/MACD + volume confirmation; tag trades and monitor equity curve |
| Mean Reversion | Medium: statistical thresholding and regime detection | Moderate: historical data, indicator tools; fewer trades | ⭐⭐ Consistent wins in ranging markets; large losses if trend resumes | Option sellers & swing traders in range-bound instruments | 💡 Trade at statistical extremes (z-score/Bollinger); track regime win rates |
| Trend Following | Medium: rule-based systems and discipline over time | Low–Moderate: less frequent trades, capital to carry positions | ⭐⭐⭐ Captures large, sustained moves; late entries reduce upside | Position traders and long-term investors across assets | 💡 Use moving averages and strict rules; tag trend phases (early/mid/late) |
| Breakout Trading | Medium–High: precise level identification and timing | High: rapid execution, volume analytics, active monitoring | ⭐⭐⭐ High risk-reward when genuine; many false breakouts exist | Day/swing traders and option plays around catalysts | 💡 Require volume confirmation; log successful vs false breakouts for pattern recognition |
| Swing Trading | Low–Medium: technical pullback setups + risk management | Moderate: capital tied overnight, periodic monitoring | ⭐⭐ Stable returns capturing short-to-medium moves | Part-time traders and working professionals | 💡 Use MA pullbacks/Fibonacci; tag pullback depths and log overnight gaps |
| Options Income / Premium Selling | Medium: option Greeks, assignment & expiry management | Moderate: margin/capital, options platform, Greeks monitoring | ⭐⭐⭐ High-probability income with capped upside; assignment risk | Income-focused investors and options traders | 💡 Track theta decay and Greeks; tag income trades and monitor monthly premium |
| Statistical Arbitrage / Pairs Trading | High: quantitative models, cointegration, continuous monitoring | High: data infrastructure, coding, low-latency execution | ⭐⭐ Market-neutral, lower systematic risk but fragile in stress | Quant traders and funds with tech capabilities | 💡 Monitor spread & correlation; log triggers and rebalance rules |
| Earnings Play / Catalyst Trading | Medium: calendar management and IV/option analytics | High: high IV costs, rapid adjustments around events | ⭐⭐⭐ Potential for outsized returns; binary outcomes and IV crush risk | Event-driven option traders and speculative investors | 💡 Map catalysts on calendar, tag trades, and track IV entry vs exit |
| Dollar-Cost Averaging (DCA) / Accumulation | Low: simple recurring buys, minimal active decisions | Low: modest regular capital, automated contributions | ⭐⭐ Long-term steady accumulation; reduces timing risk | Long-term investors and beginners with limited capital | 💡 Automate deposits, tag DCA purchases, and track average cost basis |
| Technical Analysis / Price Action Trading | Medium–High: subjective chart reading & pattern recognition | Low–Moderate: charting tools and time for study | ⭐⭐⭐ Versatile across timeframes; outcome depends on trader skill | All trader types who read charts (stocks, forex, crypto) | 💡 Focus on supply/demand zones and candlesticks; log pattern types and win rates |
From Strategy to Execution: Your Next Steps
We have journeyed through a comprehensive collection of ten distinct and powerful trading approaches, from the rapid pace of Momentum Trading to the patient accumulation of Dollar-Cost Averaging. Each of these great trading strategies offers a unique lens through which to view the markets, complete with its own set of rules, risk parameters, and psychological demands. The sheer variety can feel overwhelming, but the goal was never to encourage you to become a jack-of-all-trades. Instead, it was to present a menu of proven methodologies so you can find the one that fits you.
The most profitable strategy in the world is useless if it doesn’t align with your personality, risk tolerance, and lifestyle. A scalper’s mindset is fundamentally different from that of a long-term trend follower. The key takeaway is that success is not found in a secret formula, but in the intersection of a well-defined strategy and your ability to execute it with relentless consistency.
The Path from Knowledge to Profitability
Merely reading about these strategies is the equivalent of studying a map; it doesn’t move you to your destination. The real work — the kind that forges discipline and builds equity curves — begins now. It’s a methodical process that separates aspiring traders from consistently profitable ones.
Your immediate next steps should be systematic and deliberate:
- Select and Specialize: Choose one or two strategies from this list that genuinely resonate with you. Do you prefer frequent, small wins (Scalping, Mean Reversion), or are you comfortable holding for larger moves (Trend Following, Swing Trading)? Be honest with yourself about the time you can commit and the psychological pressure you can handle.
- Deep Dive and Backtest: Once selected, your chosen strategy becomes your singular focus. Study its mechanics in depth. Then, use historical data to rigorously backtest the rules. Does it have a positive expectancy? What is its maximum drawdown? This historical analysis is not about predicting the future, but about validating the statistical edge of your system.
- Paper Trade with Purpose: Move from historical data to a live market environment with a paper trading account. The goal here is not to make hypothetical money, but to test your emotional and psychological fortitude. Can you execute your plan flawlessly when real-time price action is creating fear or greed? Treat every paper trade as if real capital were on the line.
The Unwavering Power of Data-Driven Discipline
A common thread woven through the journey of every successful trader is an obsession with data. Hope is not a strategy, and gut feelings are notoriously unreliable. The only way to evolve from gambling to running a trading business is to meticulously track, analyze, and optimize your performance. This is where a high-quality trading journal becomes non-negotiable.
Key Insight: A trading strategy provides the ‘what’ and ‘when’ to trade. A trading journal provides the ‘why’ behind your results, revealing patterns in your execution that no backtest ever could. It is the ultimate tool for self-coaching and refinement.
By logging every entry, exit, and the rationale behind each decision, you create an invaluable feedback loop. You can identify which setups are truly profitable for you, which market conditions you excel in, and, most importantly, which psychological biases are costing you money. Without this data, you are simply flying blind, destined to repeat the same mistakes. The path to mastering great trading strategies is paved with the insights you gain from your own performance data. It transforms your trading from a series of isolated events into a cohesive, data-driven system built for long-term success.
Ready to turn theory into a data-driven practice? Start tracking your trades with TradeReview to analyze your performance, identify your edge, and refine the great trading strategies you’ve learned today. Sign up for free and begin your journey to consistent, disciplined trading at TradeReview.