
A day trading journal is your personal logbook for every single trade you make. It’s where you meticulously record what happened, why it happened, and what you can do better next time. This isn’t just about tracking profits and losses — it’s about turning raw data into powerful insights, shifting you from trading on gut feelings to making decisions backed by your own performance data.
Think of it as the ultimate tool for building discipline and making consistent, measurable progress in your trading career.
Why a Journal Is Your Most Powerful Trading Tool
Let’s be real — day trading is a relentless psychological battle. The difference between long-term success and failure often comes down to one thing: discipline. Your day trading journal is the one tool that acts as a perfect mirror, showing you exactly how you’re behaving in the markets, free from ego or wishful thinking.
It’s all too easy to remember that one huge win and conveniently forget the five small losses that completely wiped it out. A journal forces you to be honest with yourself. When you log every single trade, you create an undeniable record of your actions, making it impossible to ignore when you deviate from your plan.
Uncover Your Hidden Trading Flaws
Without a journal, you’re just guessing. We’ve all been there: Did you sell too early because fear took over? Did you hold that losing position way too long, hoping for a miracle turnaround? A journal brings these destructive emotional habits into the light.
Here’s a practical example: You take a frustrating loss and immediately jump into another trade to “make it back.” That’s revenge trading, and it’s one of the fastest ways to blow up an account. Your journal will make this pattern painfully obvious. You’ll see the impulsive entry right after a loss, the rules you broke, and the inevitable red number in your P&L column. Seeing this pattern documented over and over provides the hard evidence you need to finally address it.
A trading journal is the only way to get objective feedback on your performance. It separates what you think you’re doing from what you’re actually doing in the markets.
By consistently logging your trades, you can finally spot and fix these costly mistakes.
- FOMO (Fear of Missing Out): Are you always chasing stocks after they’ve already made a big move? Your journal will show a clear pattern of late entries at terrible prices.
- Impulsive Decisions: Logging your emotional state before each trade will reveal if you’re trading out of boredom or anxiety instead of waiting for a solid, pre-planned setup.
- Strategy Drift: Do you have a great plan but abandon it halfway through a trade? Your notes will pinpoint the exact moments your discipline broke down.
From Personal Diary to Professional Business Plan
Don’t mistake your journal for a simple diary. It’s the business plan for your entire trading career. Every professional field uses performance reviews and data to improve, and trading is no different. No one promises guaranteed profits in the market, but a professional process gives you the best possible chance to succeed over the long term.
With individual traders now accounting for a massive 20-35% of daily volume, standing out requires a professional approach. A meticulous journal is what separates the pros from the crowd. You can learn more about this incredible shift from the World Economic Forum’s report on retail investor market participation.
At the end of the day, a day trading journal provides the structure you need for long-term growth. It builds the discipline required to handle market swings and lays the groundwork for consistent, thoughtful trading. It’s not about finding a magic bullet — it’s about building a process that can last.
Designing a Journal That Actually Works for You
A great day trading journal is so much more than a simple list of wins and losses. Think of it as your personal performance analytics tool, but its value is only as good as the data you feed it. Building a journal that actually gives you an edge means tracking the right information from the very first trade.
Let’s walk through how to create a blueprint that’s both comprehensive enough to be useful and simple enough to maintain. The goal here is to build a living document that captures not just the what (your P&L) but the why behind every single trade. This is what separates traders who learn from their mistakes from those who are doomed to repeat them.
The Anatomy of an Insightful Trade Log
To get real value, you need to capture a mix of quantitative data (the numbers) and qualitative data (the context). The numbers tell you if a trade worked, but the context explains why it worked — or why it fell apart.
First things first, you have to cover the basics. These are the non-negotiable data points every journal entry needs:
- Date and Time: Pinpoints when you traded. This is crucial for spotting patterns around the market open, midday lulls, or the closing bell chaos.
- Ticker Symbol: The instrument you traded (e.g., AAPL, SPY, EUR/USD).
- Entry and Exit Prices: The exact prices where you got in and out.
- Position Size: How many shares or contracts you traded. This helps you understand how risk and sizing impact your bottom line.
- Net P&L: The final profit or loss on the trade after commissions and fees.
These fields give you the raw data, but the real magic happens when you start adding the story behind the numbers.
A journal without context is just a glorified bank statement. The qualitative data — your thoughts, your strategy, your emotional state — is what turns a simple log into a powerful performance-improvement tool.
Going Deeper: What to Actually Track
This is where you start building a real feedback loop. Adding these essential and optional fields helps you connect your actions to your outcomes, turning your journal into a personal trading coach.
Here’s a look at the data points that make a real difference, broken down by what’s essential versus what you might add as you gain more experience.
Essential vs Optional Journal Fields
| Field | Why It’s Essential | Example Entry |
|---|---|---|
| Trade Setup/Strategy | Identifies which of your strategies are performing best. Without this, you’re just guessing what works. | “5-minute ORB (Opening Range Breakout) long entry after price reclaimed the VWAP.” |
| Reason for Entry | Forces you to articulate your thesis. Was it a technical signal, a news catalyst, or an impulse? | “Bull flag forming on the 1-minute chart, confluent with strong buying volume.” |
| Emotional State | This is the most underrated but critical field. It reveals emotional triggers like FOMO, greed, or fear. | “Felt patient and confident, waited for the setup to confirm before entering.” |
| Mistakes Made | Brutal honesty here is key. This helps you identify and systematically eliminate recurring errors. | “Held onto the loser too long, hoping for a bounce instead of respecting my stop-loss.” |
By tracking these elements, you can start filtering your trades to answer the questions that truly matter. You might discover that your “Opening Range Breakout” strategy has a 70% win rate when you feel patient, but only a 30% win rate when you feel rushed. That is a game-changing insight you’d never uncover without detailed logging.
Vague vs. Detailed: A Real-World Comparison
Imagine it’s the end of the week and you’re reviewing your trades. Let’s compare two entries for the exact same trade to see the massive difference in analytical value.
Vague Entry:
- Ticker: NVDA
- P&L: -$150
- Notes: Bad trade.
This tells you absolutely nothing. You can’t learn from it, and you can’t prevent it from happening again. It’s totally useless.
Detailed Entry:
- Ticker: NVDA
- P&L: -$150
- Strategy: Failed breakout short
- Reason for Entry: Saw price reject a key resistance level and entered short.
- Emotional State: Anxious, felt like I was missing moves after a slow morning.
- Mistakes Made: Chased the entry after the initial move down. My entry price was poor, and my stop-loss was too wide. This was a classic FOMO trade, not part of my plan.
See the difference? The detailed entry hands you a clear, actionable lesson on a silver platter. You can identify that the root cause was your emotional state (anxiety and FOMO), which led directly to a violation of your trading plan. Now you have something concrete to work on next week.
If you’re using a spreadsheet, creating these columns is straightforward. For those looking to build a more robust system from scratch, our guide on how to create an Excel trading journal provides a step-by-step walkthrough.
Your journal is your personal trading database. The more high-quality data you put in, the more valuable insights you’ll get out.
Building a Consistent Journaling Habit
Let’s be honest: an empty day trading journal is useless. The real magic happens when logging your trades becomes a non-negotiable part of your daily routine — a habit as ingrained as checking the pre-market movers. This isn’t about finding more hours in the day. It’s about creating a simple, sustainable workflow that turns your journal from a tedious chore into your most powerful analytical tool.
Consistency is what turns raw data into market wisdom. Here’s how to build a practical routine that seamlessly integrates journaling into your trading day, ensuring you capture the insights that actually lead to growth.
The Daily Rhythm: Pre-Market and Post-Market
Your journal should be the bookends of your trading session. The process starts before the opening bell rings and finishes well after it closes, creating a disciplined structure built on preparation and honest reflection.
The Pre-Market Warm-Up (10-15 Minutes)
Before you even think about placing a trade, open up that journal. The goal here isn’t to log new trades but to learn from the old ones. Think of it as a mental warm-up, a quick and focused review to get your head in the game.
- Look at Yesterday’s Biggest Loser: What went wrong? Was it a broken rule, a flash of FOMO, or a setup that just wasn’t there? Reconnect with that feeling and make a conscious commitment to sidestep that specific error today.
- Study Yesterday’s Best Winner: What did you nail? Did you stick to your plan perfectly? Were you patient? This reinforces the exact behaviors you want to replicate.
- Set One Clear Intention: Based on that review, what’s the single most important thing to focus on today? It might be something like, “I will not trade the first 15 minutes,” or “I will respect my hard stop-loss on every single trade.”
This simple routine primes your brain for discipline. It immediately shifts your focus from chasing profits to flawlessly executing your process.
The Post-Market Cool-Down (15-20 Minutes)
This is where you capture everything while it’s still fresh. Don’t put this off. The emotions, the split-second thoughts, and the subtle nuances of a trade fade incredibly fast.
Log every trade you took, filling in all the essential fields we talked about. Be brutally honest with yourself, especially when it comes to the “Mistakes Made” and “Emotional State” columns. This daily habit of radical self-assessment is what separates the pros from the rest.
The process boils down to capturing three core components for every single trade: the entry, the setup, and your mindset.
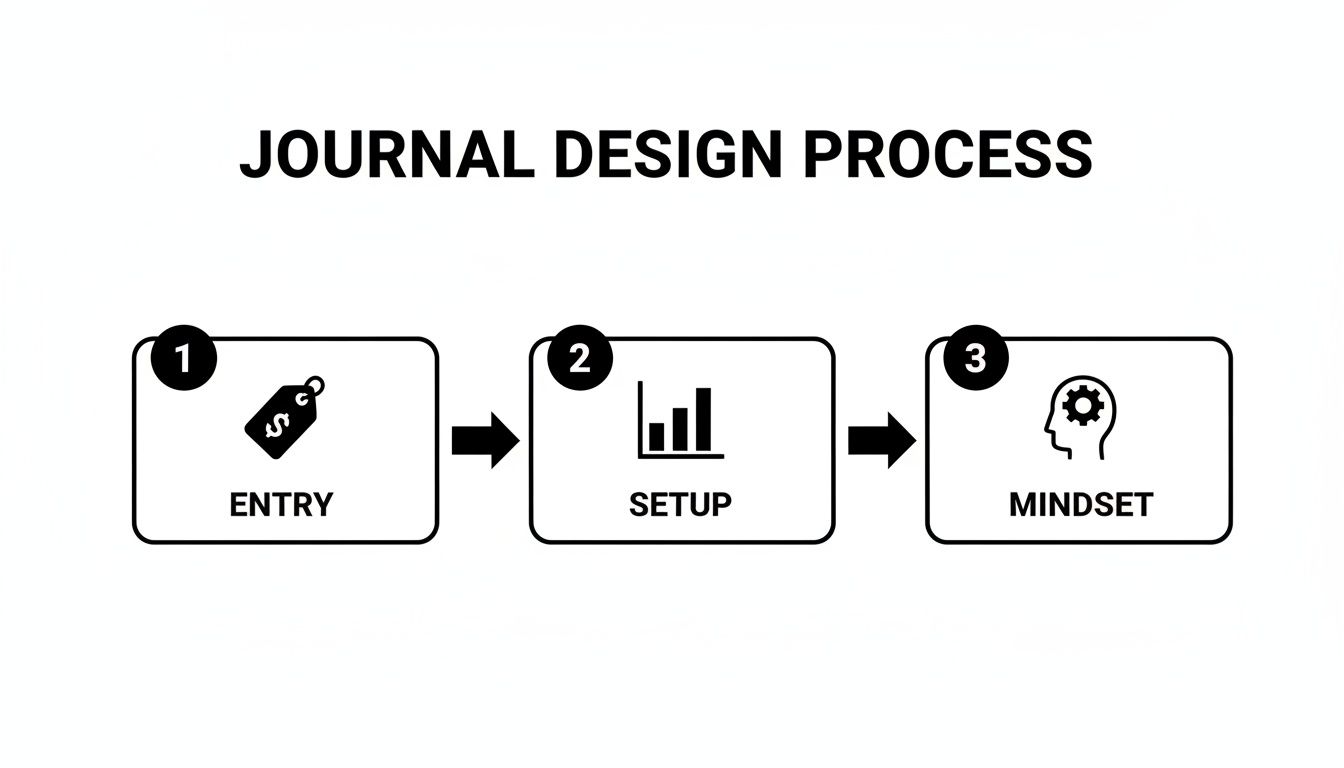
This reminds you that a trade is never just about the numbers; it’s a mix of a technical setup and your psychological reaction to it.
The Weekly Deep-Dive Session
If your daily entries are about collecting clues, the weekly review is where you solve the case. This is your dedicated time — carve out an hour or two on a Saturday or Sunday — to zoom out and see the bigger picture your data is painting.
Your goal isn’t just to glance at your P&L. It’s to become a detective, hunting for the hidden patterns that are truly driving your trading performance.
The daily journal entries are the clues. The weekly review is where you solve the case. This is where you find your edge.
Use this checklist to guide your weekly investigation:
- Filter and Sort: Start by sorting your trades by P&L. Force yourself to analyze your top five winners and your top five losers for the week. What do they have in common? Is there a pattern in the time of day, the setup, or the asset?
- Identify Profitable Patterns: Which trading setup or strategy actually made you the most money? Was it the opening range breakout? The VWAP bounce? The data will tell you what’s working so you can do more of it.
- Find Your Kryptonite: What is your single most expensive mistake? Filter your journal for trades you tagged with “revenge trading” or “held a loser too long.” Seeing the cumulative financial damage of one repeated bad habit is a powerful motivator for change.
- Analyze Key Metrics: Go beyond your win rate. Calculate your profit factor (gross profits divided by gross losses). A profit factor above 1.5 is a good benchmark, but what matters most is seeing it improve over time. Also, compare your average win to your average loss. If your average winner is at least 2x the size of your average loser, you’re on the right track.
- Set Goals for Next Week: Based on your findings, create one or two specific, measurable goals for the upcoming week. Something like, “I will increase my average risk-to-reward ratio from 1.5:1 to 2:1 by cutting my losers faster.”
This structured weekly review transforms your day trading journal from a simple logbook into a dynamic tool for constant improvement. It’s the process that builds the discipline and long-term thinking required to actually succeed in these markets.
How to Analyze Your Data to Find a Real Edge
This is the moment all that consistent journaling starts to really pay off. You’ve collected the raw data; now it’s time to turn it into a genuine strategic advantage. Analyzing your day trading journal isn’t just about checking your win rate. It’s about launching a full-blown investigation to uncover the hidden patterns driving your profitability.
Many traders get stuck here, just staring at a spreadsheet packed with numbers. The secret is to start asking the right questions. Your journal has all the answers, but you have to know what to look for.
Moving Beyond Simple Win Rates
Let’s be clear: your win rate, on its own, is a vanity metric. A trader with a 40% win rate can be incredibly profitable, while someone hitting 70% winners might still be losing money. The metric that truly matters is your expectancy — what you can realistically expect to make or lose, on average, for every single dollar you put at risk.
This kind of analysis forces you to get real about what’s actually driving your P&L. It’s all about understanding the critical relationship between how often you win and how much you win.
Your goal isn’t just to win more often. It’s to ensure your winning trades are significantly larger than your losing ones. Data analysis is how you figure out exactly how to achieve that.
Asking the Questions That Matter
Think of your journal as a powerful database just waiting for you to query it. By filtering and sorting your trade logs, you get concrete answers to the most important questions about your performance. This is how you stop trading on gut feelings and start executing based on cold, hard statistical evidence.
Here are the essential questions you should start with:
- Which trading setup is actually making me money? Go ahead and filter your trades by your “Strategy/Setup” tag. You might find that the setup you felt was your best is barely breaking even, while a less exciting one is a quiet, consistent winner.
- Do I perform better at certain times of the day? Compare your P&L from the market open against the midday session. So many traders discover their performance nosedives after 11 a.m., a clear sign that sitting on their hands during the slow hours could instantly improve their bottom line.
- How does market volatility affect my results? Tag your trades based on market conditions (e.g., “High Volatility,” “Ranging”). This can tell you if your strategy needs chaos to thrive or if it performs better in calmer, more predictable environments.
Answering these questions gives you a clear, actionable game plan. If you find out your long setups are winners but your shorts are bleeding you dry, the path forward is obvious: do more of what works and cut out what doesn’t.
Pinpointing Your Unique Statistical Edge
Every consistently profitable trader has a statistical edge, and your journal is the tool you use to find it. This edge is a very specific set of conditions where you simply have a higher probability of success. It’s unique to you, your strategy, and your own psychology.
Let’s look at a real-world example. A trader notices their biggest losses always seem to cluster on Fridays. Getting curious, they filter their journal to see P&L by the day of the week:
| Day of the Week | Net P&L | Number of Trades | Average P&L per Trade |
|---|---|---|---|
| Monday | +$450 | 20 | +$22.50 |
| Tuesday | +$600 | 25 | +$24.00 |
| Wednesday | +$300 | 18 | +$16.67 |
| Thursday | +$550 | 22 | +$25.00 |
| Friday | -$1,200 | 35 | -$34.29 |
The data doesn’t lie. This trader is consistently making money Monday through Thursday but gives it all back — and then some — on Fridays. Their trade notes reveal a pattern of “forcing trades” and impatience heading into the weekend. The actionable insight? Stop trading on Fridays, or at the very least, drastically reduce size. That one simple change, backed by data, could completely transform their equity curve.
For a deeper look into organizing your data this way, check out our guide on how to build a pivot table for your trading journal. It’s a game-changing technique for slicing and dicing your data to uncover these kinds of insights.
The global markets are massive, with the foreign exchange market alone seeing average daily volumes that can reach trillions of dollars. For instance, the Bank for International Settlements reports on these vast figures periodically. In such a competitive arena, a detailed day trading journal is what helps you find your small, repeatable edge in all that noise.
Ultimately, analyzing your data is about taking control. You become your own performance coach, methodically refining your strategy based on what the numbers prove is working. This is the disciplined, forward-thinking approach that builds a real, lasting trading career.
Making Your Journaling More Efficient with Automation
Let’s be honest, manual data entry can be a soul-crushing task that kills the journaling habit for even the most disciplined traders. Who wants to spend an hour every night copying and pasting trade details from their broker into a spreadsheet? It’s tedious, mind-numbing, and a huge source of errors.
A single typo can completely throw off your analysis, leading you to draw the wrong conclusions about what’s working and what isn’t.
This is exactly why so many traders give up on their day trading journal. But it doesn’t have to be this way. Modern tools can get rid of this friction completely. Automation isn’t just a fancy feature; it’s about getting your time back and making sure your data is always right.
The Power of Direct Broker Syncing
Imagine this: you finish your last trade of the day, shut down your platform, and your journal is already filled out. Every single trade is there, complete with the right entry prices, exit times, and position sizes. That’s the power of syncing your journal directly with your broker.
Platforms like TradeReview connect to your brokerage account and pull in your entire trade history automatically. This saves you hours of grunt work every week and, more importantly, guarantees 100% data accuracy. No more forgotten trades or mistyped numbers.
This seamless connection lets you focus on what actually matters: adding the why behind the trade. Your thoughts, your emotions, the setup you saw — that’s the stuff that makes you a better trader.
By automating the quantitative data entry, you free up mental energy to focus on the qualitative analysis. This is where you uncover your true edge.
Instead of wrestling with spreadsheets, you can dive straight into analyzing your day’s performance. You can see more about the benefits of connecting your broker to your journal and how it changes the game.
Capturing Insights on the Go
Trading insights don’t always happen neatly at your desk. Sometimes the biggest “aha!” moment about a trade hits you right after you close it, maybe while you’re grabbing lunch or just stepping away from the screen for a minute.
This is where having mobile access to your journal becomes incredibly valuable. Being able to pull up your day trading journal on your phone lets you capture those thoughts before they disappear.
- Immediate Note-Taking: Just finished a frustrating revenge trade? Open the app and add a quick voice note or type a few sentences about what you were feeling.
- Tagging on the Fly: Nail a perfect entry based on your plan? Tag the trade “Excellent Patience” while the feeling of discipline is still fresh.
- Review from Anywhere: Stuck in a line? Use that downtime to scroll through your recent trades and reflect on your performance without being glued to your main computer.
When you can weave journaling directly into your trading day, it stops feeling like a chore. The real goal of automation isn’t just about saving time; it’s about making self-review so effortless that it becomes a natural part of your routine. You spend less time on busywork and more time making the smart decisions that actually grow your account.
Answering Your Top Day Trading Journal Questions
Knowing you should keep a trading journal is one thing. Actually sticking with it when you’re in the heat of a trading session is a whole different ball game. It’s normal for practical questions and roadblocks to pop up along the way.
Let’s tackle some of the most common hurdles traders face. Here are some no-nonsense answers to help you build a consistent journaling habit that actually moves the needle on your performance.
Spreadsheet vs. a Dedicated Journal Tool?
This is usually the first fork in the road. Do you build your own spreadsheet or use a dedicated platform?
A spreadsheet is a great place to start. It’s free, you can customize it however you want, and it really forces you to think about what data matters to you. The big downside? You have to build and maintain all the analytics yourself. This can be a massive time sink, and one little formula error can derail your entire analysis.
A dedicated journaling tool, on the other hand, automates the heavy lifting. It can sync with your broker to pull in trades automatically, which means no more manual entry. It also instantly calculates key stats like your profit factor and win rate and serves up interactive charts to help you see what’s really going on.
A spreadsheet forces you to be a data analyst first and a trader second. A dedicated tool lets you focus on being a trader.
At the end of the day, a spreadsheet is a logbook. A dedicated tool is an analytical engine.
How Often Should I Actually Review My Journal?
Consistency is key, but what does that really mean in practice? The most effective approach is a two-part review process that turns raw data into real, actionable insights.
- Daily Review (15 Minutes): Log your trades right at the end of your session. Do it while the details — and more importantly, the emotions — are still fresh in your mind. Note the setup, your mindset, and any mistakes you made. This is all about capturing the raw data.
- Weekly Review (1-2 Hours): This is where the magic happens. Set aside a block of time when the markets are closed to zoom out and look at the bigger picture. This is your time to spot patterns, dissect your biggest wins and losses, and set clear, data-driven goals for the week ahead.
The daily review is for logging what happened. The weekly review is for understanding why it happened and what you’re going to do about it.
“My Journal Shows I’m Unprofitable. What Now?”
First off, congratulations! If your journal is showing you that you’re unprofitable, it’s doing its job perfectly. This isn’t a sign of failure; it’s a diagnostic tool that just handed you a clear roadmap of what to fix. This is a huge step forward.
So, where do you begin?
Filter for Your Biggest Losers
Start by isolating your five to ten largest losing trades. Lay them all out and look for common threads.
- Was it a specific setup?
- A particular time of day?
- Did you break a rule you can tag, like “revenge trading” or “FOMO”?
You’ll often find that a huge chunk of your losses comes from a small handful of recurring, emotionally-driven mistakes. Spotting the pattern is the first step to stamping it out.
Analyze Your Risk-to-Reward Ratio
Next up, compare your average winning trade to your average losing trade. A lot of consistently profitable traders win less than 50% of the time. They still make money because their winners are significantly bigger than their losers. If your average win is the same size as your average loss (a 1:1 ratio), you need an incredibly high win rate just to break even.
Focus on finding setups that offer a better risk-to-reward profile, and get much more aggressive about cutting your losers early.
Check Your Trade Frequency
Finally, look at your performance based on the number of trades you take per day. It’s incredibly common for traders to be profitable on their first one or two trades, only to see performance fall off a cliff after that. This is a dead giveaway for mental fatigue and overtrading. The data might be screaming at you that the best move is to simply stop trading after your third trade — win or lose.
Ready to stop guessing and start analyzing? TradeReview offers powerful analytics, auto broker sync, and a user-friendly interface to turn your trade data into a real edge. Build a better trading process today. Get started for free at https://tradereview.app.


