Backtesting is how you test a trading strategy against historical market data to see how it would have performed. It’s a make-or-break, data-driven step that turns trading from a pure gamble into a calculated business. More importantly, it helps you validate your ideas and build real confidence before a single dollar is at risk.
Why Backtesting Is a Non-Negotiable Trading Skill
Let’s be honest — trading on a hunch or a “hot tip” is a recipe for disaster. It’s a painful cycle: you find what looks like the perfect setup, go live with real capital, and then watch your account balance shrink. That emotional rollercoaster is one of the biggest roadblocks to consistent profitability, and it’s a struggle almost every trader faces.
The problem is making decisions driven by hope and fear instead of cold, hard evidence. Backtesting is the perfect antidote. It’s not about finding a “guaranteed” holy-grail system that never loses. It’s about building a professional, repeatable process you can trust, especially when the markets get choppy.
From Gambling to a Calculated Business
Think of backtesting as your personal trading laboratory. It’s a totally risk-free environment where you can stress-test your ideas against years of market history. This simple discipline completely transforms your approach from a series of hopeful bets into a structured business operation.
Instead of just guessing, you get to answer critical questions with actual data:
- Does this idea even have an edge? See if your strategy would have been profitable through different market cycles—bull, bear, and everything in between.
- How much risk am I really taking on? Uncover the strategy’s worst historical losing streak, what traders call the maximum drawdown.
- Can I psychologically handle the lows? Knowing a 25% drawdown is normal for your system prepares you to stick with it during the tough times, instead of panicking and abandoning ship at the worst possible moment.
The process is straightforward: you apply your trading rules to historical price and volume data to simulate how it would have played out. A good backtest will provide key metrics like net return, the Sharpe ratio (a measure of risk-adjusted return), and that all-important maximum drawdown.
For example, a test might show your strategy has a solid 12-15% annualized return but also reveal a gut-wrenching 20-30% maximum drawdown. That’s the kind of realistic picture you need. If you want to dive deeper into these metrics, you can learn more from financial modeling experts.
Backtesting is the foundational habit that separates consistently profitable traders from the crowd. It builds unshakable confidence in your approach because your belief is rooted in data, not hope.
Ultimately, this preparation is what gives you the discipline to execute your plan when real money is on the line. You trust the process because you’ve already seen it work through hundreds or even thousands of simulated trades. It’s the difference between navigating with a map and just wandering around in the dark.
Before we get into the “how-to,” let’s quickly break down the key parts of a solid backtest. Understanding these components will help you build a process that gives you reliable, actionable results.
Key Components of a Robust Backtest
| Component | What It Means | Why It’s Critical |
|---|---|---|
| Historical Data | The high-quality price, volume, and indicator data your test runs on. | “Garbage in, garbage out.” Without clean, accurate data, your results are meaningless. |
| Trading Rules | Your specific criteria for entering, exiting, and managing a trade. | These rules must be 100% objective so they can be tested consistently and without bias. |
| Performance Metrics | The numbers that measure your strategy’s effectiveness (e.g., net profit, drawdown, Sharpe ratio). | Metrics move you beyond a simple “did it make money?” to “how did it make money and what was the risk?” |
| Market Conditions | The different environments (e.g., bull, bear, volatile) your strategy is tested against. | A strategy that only works in a raging bull market is a recipe for disaster. You need to know its limits. |
| Parameter Settings | The variables in your strategy, like moving average lengths or stop-loss levels. | Testing different settings helps you understand how sensitive your strategy is to small changes. |
Having a grasp on these elements is what turns a simple back-of-the-napkin test into a professional-grade analysis that you can actually build a trading career on.
Assembling Your Backtesting Toolkit
Before you can dive into testing your trading ideas, you need to get your house in order. Think of it like a chef preparing their ingredients and tools before cooking—it’s all about having the right setup. If you just jump in without a solid plan, you’re not backtesting; you’re just playing with data.
The whole process really boils down to two things: trustworthy data and a crystal-clear, testable idea.

It all starts with data. Good, clean historical data is the absolute foundation of any backtest worth its salt. This part is non-negotiable. Why? Because of a timeless principle: garbage in, garbage out. If your data is messy—full of gaps, errors, or weird spikes—your test results will be useless and give you a dangerously false sense of confidence.
You can get data from free sources, but they often have quality or depth issues. For serious traders, paid data providers are usually a worthwhile investment because they offer much cleaner and more comprehensive datasets.
Choosing Your Software
Once you’ve got your data, you need a place to run your tests. The software you choose really depends on how complex your strategy is and how comfortable you are with code.
- Spreadsheets (Excel, Google Sheets): For simple strategies based on end-of-day data, a spreadsheet can work surprisingly well. It’s a great way to start and manually walk through trades to make sure you understand the logic inside and out.
- Trading Platforms: Many platforms like TradingView or NinjaTrader come with built-in backtesting tools. These are usually pretty user-friendly and don’t require any coding, letting you set up your rules and get a performance report quickly.
- Custom Scripts (Python): If your system is highly complex or you’re venturing into automation, writing your own script gives you the most power and flexibility. This definitely requires some programming chops, but it puts you in complete control. If you’re curious about this path, it helps to understand what algorithmic trading involves.
The most important tool isn’t your software—it’s your ability to define your strategy with 100% objectivity. If a rule is subjective, like “buy when the chart looks bullish,” you can’t test it reliably.
Defining Your Strategy Rules
This is where your vague trading idea gets turned into a concrete, testable system. You have to nail down every single parameter with precision, leaving zero room for interpretation on the fly.
Let’s use a simple moving average (MA) crossover strategy as a practical example. An MA is just the average price of an asset over a specific number of periods, used to smooth out price action and identify trends.
Say your idea is to buy when a fast MA crosses over a slow MA. To make that testable, you need to define everything:
- Asset: What are you trading? (e.g., SPY ETF)
- Timeframe: What chart interval are you looking at? (e.g., Daily chart)
- Entry Trigger: What exactly signals a buy? (e.g., Buy at the open of the next bar after the 20-day MA closes above the 50-day MA).
- Profit Target: Where do you get out with a win? (e.g., Sell when the price hits a 10% profit from the entry).
- Stop-Loss: Where do you cut your losses? (e.g., Sell if the price drops 5% below the entry).
- Position Sizing: How much capital do you put on the line? (e.g., Risk 1% of total account equity per trade).
By spelling out every variable, you remove emotion and subjectivity from the equation. Your backtest becomes less of a casual observation and more of a repeatable, scientific experiment.
How to Interpret Your Backtesting Results
So, you’ve run your backtest and now you’re staring at a screen full of numbers. That’s the easy part. The real art is learning how to read the story that data is telling you. It’s incredibly tempting to just zero in on the Net Profit, but that single number completely glosses over the emotional rollercoaster you would have actually been on to get there.

A proper analysis goes much deeper. It helps you figure out if your strategy can actually survive in the wild. We need to look at metrics that reveal the risk, the pain, and the consistency—not just the final P&L. This is all about building trading habits that can last for the long haul.
Moving Beyond Simple Profit
Let’s dig into the metrics that really matter. These numbers are what reveal the true character of your strategy—its strengths, its flaws, and whether you can realistically stick with it when the market gets ugly.
Here are the crucial performance metrics you absolutely must analyze:
- Maximum Drawdown: This is the biggest hit your account takes from a peak. Think of it as the ultimate test of your nerve. A strategy might look fantastic on paper, but if it has a 40% maximum drawdown, could you honestly keep trading it without hitting the panic button?
- Sharpe Ratio: This metric tells you if the returns were actually worth the risk you took. A higher Sharpe Ratio (aim for over 1.0) suggests you’re getting paid well for the volatility you’re enduring. It’s a great way to avoid those high-profit strategies that are just dangerously erratic.
- Profit Factor: Simply put, this is your gross profit divided by your gross loss. A number above 2.0 is considered rock-solid because it means your winning trades made at least twice as much as your losing trades lost.
For instance, a strategy with a flashy 80% win rate might seem like a sure thing. But if the average winner is only +$50 and the average loser is -$300, the profit factor would be terrible, and the strategy would bleed you dry over time. Getting a handle on these nuances is a core part of developing smarter trading habits and ties directly into the broader discipline of using essential market analysis techniques.
A Real-World Example
Let’s go back to our simple moving average crossover strategy. We run it on 10 years of historical data for the SPY ETF and get our performance report. A good backtest won’t just spit out a final profit number; it will give you a rich set of data to really dissect.
Here’s a snapshot of what those results might look like:
| Metric | Result | Interpretation |
|---|---|---|
| Total Net Profit | $23,500 | The headline number. Looks good, but tells us nothing about the ride. |
| Max Drawdown | 22% | The strategy coughed up 22% from its peak. That’s a serious dip, but manageable for many. |
| Sharpe Ratio | 0.85 | Decent risk-adjusted return, but not exactly stellar. |
| Win Rate | 45% | This strategy lost more often than it won. That can be tough, psychologically. |
| Avg. Win / Avg. Loss | 3.1 | Here’s the secret sauce! The average winner was over 3x bigger than the average loser. |
This analysis tells a much more interesting story. The strategy makes money not because it’s right all the time, but because its wins are massive compared to its losses. This is a classic trend-following profile. Knowing this prepares you for the inevitable strings of small losses you’ll have to sit through to catch the next big winner.
Quantitative trading strategies are built on this kind of detailed analysis, combining mathematical models with tons of historical data. Pros test these systems over decades of data, scrutinizing metrics like annualized returns and drawdowns. In fact, many successful quant funds aim for annual returns of 10-20% while keeping their maximum drawdowns strictly under 15%.
The goal of interpreting backtesting results isn’t to find a perfect, flawless strategy. It’s to find a realistic one that you can actually live with. You need a strategy whose performance profile—including its drawdowns—matches your personal risk tolerance and your ability to stay cool under pressure.
Common Backtesting Pitfalls That Skew Your Results
A flawed backtest is far more dangerous than no backtest at all. It gives you a false sense of security, encouraging you to risk real capital on a strategy that was only profitable in a perfect, imaginary world. Recognizing the common traps that can completely skew your results is absolutely essential for building a trading process you can actually trust.
It’s way too easy to fall in love with a beautiful equity curve from a backtest, but that slick upward line might be hiding some serious flaws. These pitfalls aren’t just technical errors; they’re psychological traps that play on our desire to find a “perfect” system. A healthy dose of skepticism is your best defense.
The Dangers of Curve Fitting
The single most common—and destructive—pitfall is curve fitting. This is when you tweak your strategy’s parameters over and over again until they perfectly match the historical data you’re testing on. Maybe you adjust a moving average from 19 periods to 21 periods because it magically eliminates a few losing trades and bumps up the final profit.
While it feels like you’re optimizing, you’re actually just memorizing the past, not learning from it. A curve-fit strategy is incredibly fragile. It’s tailored so perfectly to one specific historical dataset that it will almost certainly fail the moment it encounters live market conditions, which are never an exact repeat of the past.
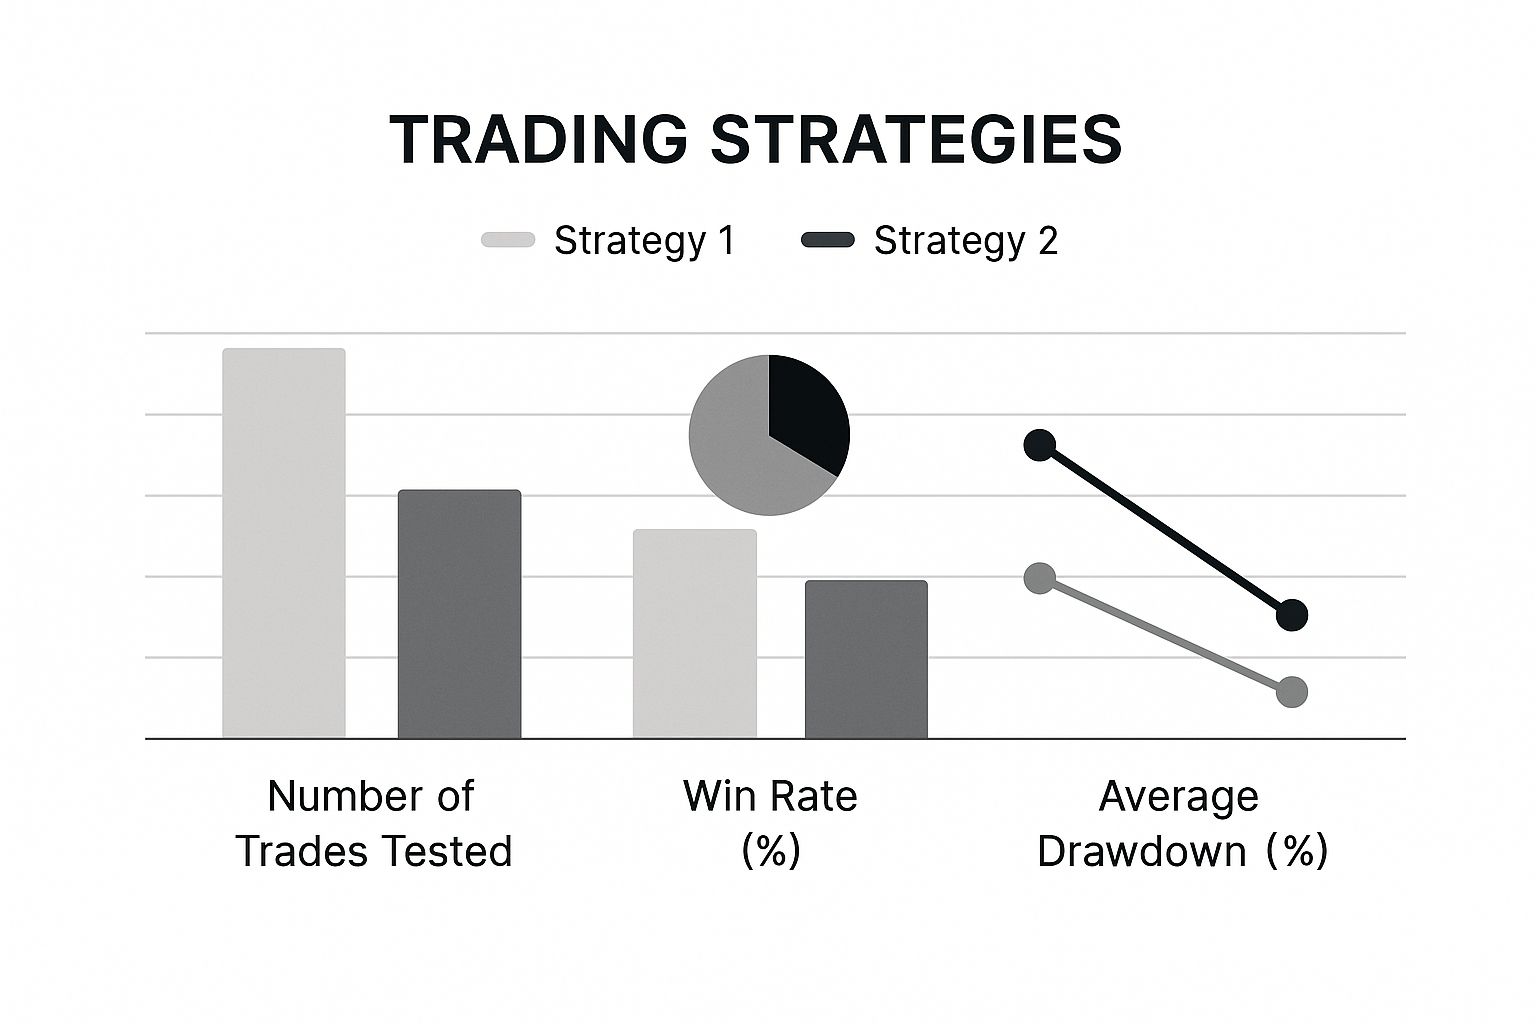
Take a look at this image. It compares two strategies and shows how a high win rate can sometimes come with a dangerously deep drawdown—a classic sign of a brittle or poorly designed system.

What this really highlights is that a lower win rate with well-controlled drawdowns often points to a much more robust and sustainable strategy for the long run.
The best way to avoid this is to use out-of-sample data. Run your initial backtest on one chunk of your historical data (say, 2015-2020), and then validate its performance on a completely separate, unseen dataset (like 2021-2023). If the results hold up, you might have a genuine edge.
Hidden Biases That Invalidate Results
Beyond curve fitting, other subtle biases can creep in and completely invalidate your findings. Just being aware of them is the first step toward producing tests you can actually rely on.
- Survivorship Bias: This happens when your test only includes assets that “survived” and are still trading today. Forgetting to include delisted stocks (from bankruptcies or mergers) will make your results look way better than they would have been in reality.
- Lookahead Bias: This is an easy mistake to make. It’s where your test accidentally uses information that wouldn’t have been available in real-time. A classic example is using the day’s closing price to trigger an entry decision at the market open.
- Ignoring Costs: A backtest that shows a profit before factoring in commissions, fees, and slippage (the gap between your expected price and your actual fill price) is pure fantasy. These small costs add up fast and can easily turn a marginally profitable strategy into a definite loser.
Backtesting isn’t just about finding what works; it’s about systematically trying to prove your ideas wrong. The table below outlines some of these common traps and, more importantly, how to sidestep them to keep your analysis honest.
Common Backtesting Pitfalls and How to Avoid Them
| Pitfall | What It Is | How to Mitigate It |
|---|---|---|
| Curve Fitting | Over-optimizing a strategy’s parameters to perfectly fit past data, making it fragile in live markets. | Validate your strategy on out-of-sample data that it wasn’t trained on. Keep parameters simple and logical. |
| Survivorship Bias | Testing only on assets that exist today, ignoring those that were delisted, which inflates performance metrics. | Use a historical dataset that includes delisted assets to get a true picture of past market conditions. |
| Lookahead Bias | Using information in your test that wouldn’t have been available at the time of the trade decision. | Ensure your code or testing process only accesses data that would have been known at the exact moment of a trade signal. |
| Ignoring Costs | Neglecting to include real-world costs like commissions, fees, and slippage in your performance calculations. | Factor in realistic estimates for slippage and all transaction costs. Even small fees can destroy an edge. |
By being mindful of these issues, you move from wishful thinking to building a genuinely robust trading plan.
A truly solid backtest should feel like you’re actively trying to break your strategy, not prove it right. Stress-test it across different market conditions and be brutally honest about its flaws.
To get statistically meaningful results, you need to test across a wide variety of market conditions using a large enough sample of trades. Many experienced traders recommend a minimum of 100-200 trades to get a more accurate read on long-term performance and minimize the role of pure luck.
But remember, even the best backtest isn’t a crystal ball. Past performance never guarantees future returns, especially as markets evolve. That’s why it’s so critical to combine it with forward testing (paper trading) before putting a single dollar at risk. For more insights on this, the team at BuildAlpha has a great guide on building a reliable backtesting process.
Transitioning from Backtest to Live Trading
Seeing a successful backtest is a huge milestone. We’ve all felt that rush of excitement from a beautiful equity curve, but it’s not a green light to immediately risk your life savings.
The jump from a simulated environment to live markets is where many promising strategies—and traders—fall apart. This is where discipline and a patient, long-term mindset become your most valuable assets.

The first step is never to fund a full-sized account. Instead, you need to begin with forward testing, which most people know as paper trading. This means you’ll be trading your strategy in real-time market conditions but with a simulated account.
Think of it as the final bridge between historical data and real-world execution. It’s your chance to confirm the strategy behaves as you expect without any financial risk. For a deeper dive, our guide explains in detail what https://tradereview.app/blog/what-is-paper-trading/ is and how to approach it effectively.
Starting Small with Real Capital
Once your forward test validates your backtested results for a month or two, it’s time to go live. But you’ll want to start with a tiny, manageable amount of real capital. The goal here isn’t to get rich; it’s to introduce the psychological pressure of trading with actual money.
This is where the true test begins. Suddenly, every tick against you feels personal. The fear of loss and the greed for more profit are real emotions that simply don’t exist in a backtest.
The most important variable you introduce in live trading is yourself. Your emotions can invalidate an otherwise profitable strategy if you don’t have a plan to manage them.
This phase is all about proving you can execute your system flawlessly when the stakes are real. It requires meticulous record-keeping. Your trading journal becomes your lifeline, allowing you to compare your live results against your backtested expectations.
Know When a Strategy Is Broken
As you trade, you will inevitably hit a drawdown. It’s part of the game. Your backtest should have prepared you for this by showing you what a “normal” losing streak looks like. By comparing your live performance to your historical data, you can answer a critical question:
- Is this a normal drawdown? If your live drawdown is within the bounds of your backtested maximum drawdown, your job is to stick to the plan with discipline.
- Or is the strategy broken? If your live losses exceed historical norms or performance degrades significantly, the market may have shifted. The strategy’s edge could be gone.
This disciplined, phased approach reinforces the professional mindset essential for long-term survival. It’s a slow, deliberate process that filters out flawed strategies and forges the emotional resilience needed to succeed.
Frequently Asked Questions About Backtesting
Even with a solid game plan, you’re bound to run into questions when you’re deep in the weeds of backtesting. It’s a field packed with nuance, and it’s perfectly normal to get hung up on the details. Getting those questions answered is what helps you move forward with real confidence.
We’ve pulled together some of the most common questions we hear from traders. Think of this as your quick-reference guide for tackling those practical challenges and cementing your understanding of the process.
How Much Historical Data Do I Need?
This is easily one of the most common questions, and the honest answer is: it really depends on how often your strategy trades. There’s no magic number that fits every system. The goal is simply to get enough data to see how your strategy holds up across a wide variety of market conditions.
Here’s a practical rule of thumb to get you started:
- For a day trading strategy: You should be looking for at least 2-3 years of intraday data, like 5-minute or 15-minute bars. This gives you thousands of different trading sessions to test against.
- For a swing or long-term strategy: You’ll want 10+ years of daily data. This is crucial for making sure your system has been tested through different market cycles—bull markets, bear markets, and those long, frustrating periods of sideways chop.
What Is a Good Sharpe Ratio?
The Sharpe Ratio is a fantastic metric for measuring risk-adjusted returns, but what’s considered “good” can be a bit subjective. Generally, any Sharpe Ratio that stays consistently above 1.0 is pretty solid. It means your returns are outpacing the volatility you had to endure to get them.
A ratio floating between 1.0 and 2.0 is considered very good, and anything above 2.0 is excellent. But don’t immediately write off a strategy with a lower Sharpe. If its returns are uncorrelated with your other strategies, it can be an incredibly valuable tool for diversifying your overall portfolio.
Can I Backtest Without Knowing How to Code?
Absolutely. Not too long ago, coding was a non-negotiable for serious backtesting. That’s just not the case anymore.
Modern trading platforms like TradingView, NinjaTrader, and TradeStation have powerful, user-friendly backtesting engines built right in. You can define your trading rules using simple point-and-click interfaces and then run complex simulations. They spit out detailed performance reports with all the key metrics, no coding required. This has truly opened the door for any trader to adopt a data-driven approach.
Ready to stop guessing and start analyzing? TradeReview provides the tools you need to journal every trade, track your performance with detailed analytics, and refine your approach based on hard data. Get started for free and turn your trading into a data-driven business at https://tradereview.app.


