If you’re serious about trading, you’ve probably heard the term backtesting. So, what does it actually mean to backtest a trading strategy?
Think of it as a dress rehearsal for your trading ideas. You take a strategy and simulate how it would have performed using historical market data. It’s your chance to see what works and what doesn’t before a single dollar of your real money is on the line. The whole point is to ditch the gut feelings and build a system grounded in cold, hard evidence, not hope.
Why Backtesting Is Your First Line of Defense

Putting your hard-earned capital into a new trading idea is nerve-wracking, and we’ve all been there. Without solid validation, you’re not really trading — you’re gambling. Backtesting is what turns that gamble into a calculated, data-driven business.
Think of it as a pilot’s flight simulator. No pilot would ever dream of flying a new plane without logging countless hours in a sim first, learning how it handles in every imaginable scenario. Trading is no different. You need to see how your strategy holds up in all market conditions — bull runs, bear markets, and those frustrating sideways grinds.
Building Confidence and Discipline
Let’s be honest: one of the toughest parts of trading is managing your own emotions. We all struggle with it. Fear and greed are notorious for causing impulsive moves, like cutting a winning trade short or holding a loser way too long. A properly backtested strategy is the perfect antidote.
When you have solid data showing your strategy has a positive edge over hundreds or thousands of trades, it’s so much easier to trust the process. That trust builds the mental toughness you need to stick to your plan, even when you’re in the middle of an inevitable losing streak.
Backtesting isn’t about finding a mythical “perfect” strategy that never loses. It’s about understanding a strategy’s personality — its strengths, weaknesses, and expected drawdown — so you can manage it effectively when you go live.
This process forces you to be systematic. Instead of chasing hot tips or reacting to market chatter, you’re building a concrete set of rules for your entries, exits, and trade management. That rule-based approach is what separates the pros from the rest.
Adopting a Professional Mindset Early
Before we dive deeper, it’s crucial to grasp the core principles that separate a professional approach to backtesting from the common pitfalls that trap new traders. Getting this mindset right from the start will save you a world of frustration and money.
Key Principles of Effective Backtesting
| Principle | Why It Matters | Common Mistake to Avoid |
|---|---|---|
| Data First, Not Hope | Your backtest is only as good as your data. The goal is to find objective truth, not to confirm your biases. | “Curve-fitting” — tweaking rules just to make past results look perfect. |
| Test for Robustness | A good strategy works across different market conditions, not just in one perfect historical period. | Assuming a strategy that worked in a bull market will work in a bear market. |
| Factor in Real-World Costs | Slippage, commissions, and fees are real. Ignoring them gives you a false sense of profitability. | Running a backtest with zero transaction costs and thinking the results are realistic. |
| Statistical Significance | A handful of winning trades means nothing. You need a large sample size to have confidence in the results. | Getting excited over a strategy that had 10 winning trades in a row. |
| Out-of-Sample Testing | This is the true test. How does the strategy perform on data it has never “seen” before? | Only testing on historical data you used to build the strategy. |
Think of this table as your foundational checklist. Every time you approach a backtest, run through these principles. It’s a simple habit that will keep you honest and focused on what truly matters: finding a durable, real-world edge.
Finally, start a trading journal from day one — yes, even for your simulations. Documenting every backtest is non-negotiable. Log your strategy rules, the markets you tested, and all the key performance numbers.
This simple habit does a few critical things for you:
- It Creates an Audit Trail: You can easily look back at how your ideas have evolved and, more importantly, avoid making the same mistakes twice.
- It Forces Objectivity: Writing everything down makes you confront the actual data, not just what you hoped the strategy would do.
- It Prepares You for Live Trading: This builds the professional habit of logging and reviewing every trade, which is absolutely essential for long-term improvement when you start trading with real money.
Ultimately, committing to rigorous backtesting is committing to a sustainable trading career. It’s the foundational work that separates the pros from the hobbyists who eventually wash out. Consider it your first, and most important, line of defense.
Sourcing and Preparing High-Quality Historical Data
A backtest is only as good as the data it’s built on. If that foundation is cracked or incomplete, the entire analysis will crumble the moment it meets real-world markets. Sourcing and meticulously cleaning historical data isn’t just a preliminary step; it’s arguably the most critical part of developing a trading strategy you can actually trust.
The old saying “garbage in, garbage out” has never been more true. Using flawed data will give you a dangerously misleading picture of your strategy’s potential. It leads to false confidence and, almost always, real losses. This process demands a detail-oriented mindset, where every data point is checked, cleaned, and properly adjusted.
Free vs. Paid Data Sources
Your first decision is where to get this data. Both free and paid sources have their place, but you have to understand the trade-offs.
- Free Data Sources: Services like Yahoo Finance or the free API tiers from various brokers are a decent place to start. They’re great for quick analysis on major stocks or forex pairs without a financial commitment. But they often come with limitations — think incomplete history, questionable accuracy, or delayed data.
- Paid Data Providers: For any serious strategy development, investing in a high-quality data feed is non-negotiable. Paid providers deliver clean, comprehensive datasets that are already adjusted for corporate actions. This is especially vital for stocks, crypto, and futures, where data quality can be all over the place.
For instance, if you’re testing a long-term stock strategy, you absolutely need data that correctly accounts for events that permanently alter a stock’s price history. This is where “data hygiene” becomes your most important job.
The Critical Steps of Data Hygiene
Clean data is about more than just having the open, high, low, and close prices. It must be adjusted for events that would otherwise completely distort your backtest results, often making a losing strategy look like a surefire winner.
Here are three of the most common — and dangerous — data issues you’ll face:
- Survivorship Bias: This one is a subtle but devastating trap. It happens when your dataset only includes companies that survived to the present day, completely ignoring those that went bankrupt or got acquired. If you test a strategy on the current NASDAQ 100 components using 20 years of data, your results will be artificially inflated. Why? Because you’ve conveniently excluded all the companies that failed along the way. Your strategy never had to navigate the losers.
- Stock Splits: When a company splits its stock (say, a 2-for-1 split), the share price is instantly cut in half. Unadjusted historical data will show this as a 50% crash overnight. Any trend-following strategy would see this as a catastrophic sell signal, creating massive errors in your backtest. Properly adjusted data smooths these events out to show the true price history.
- Dividends: For any total return strategy, dividends are a huge component of profitability. If your data only tracks price changes and ignores dividend payments, you are seriously understating the actual historical return of holding that asset. For a dividend-focused strategy, this single omission would make the entire backtest useless.
A trader’s discipline is tested long before they place a trade. It’s tested in the tedious, unglamorous work of cleaning and validating data. Rushing this step is a recipe for failure.
Think of it this way: testing on unadjusted NASDAQ 100 data is like judging a marathon runner by only timing the downhill parts of the course. You’re ignoring all the tough climbs where they might have stumbled. To back test trading strategies effectively, you have to make sure your data reflects the complete, messy, and challenging reality of the market — warts and all.
Choosing the Right Backtesting Software for You
Once you’ve got clean, reliable data, your next big decision is picking your workshop — the software you’ll actually use to back test trading strategies. This choice is far more critical than most traders realize. The right tool can fast-track your learning and discovery, while the wrong one can lead to months of frustration and, ultimately, giving up.
The software landscape can feel like a maze, but it really boils down to a trade-off between simplicity and power. It’s tempting to jump straight to the most advanced, complex platform, but that’s usually a mistake. The smart move is to start with a tool you can master quickly, score some early wins, and build momentum.
Start with What You Know: Spreadsheets
For many traders, the journey starts in a familiar place: a simple spreadsheet program like Excel or Google Sheets. This approach is surprisingly effective for strategies with clear, mechanical rules that don’t involve high-frequency decisions. It forces you to get hands-on with the data, building an intimate understanding of how your strategy behaves tick-by-tick.
The biggest plus here is accessibility. You already have the software, and there’s no new programming language to learn. But you’ll hit its limits pretty fast. Spreadsheets are notoriously slow, prone to human error, and struggle to accurately model real-world trading costs like commissions and slippage.
Visual and User-Friendly: No-Code Platforms
The next step up the ladder are no-code or low-code platforms, with TradingView being the most popular kid on the block. These tools are fantastic because they bridge the gap between clunky manual testing and full-blown programming. You can use built-in indicators and visual tools to build and test strategies right on the chart.
This visual approach is incredibly intuitive and lets you prototype ideas at lightning speed. You can see how your strategy would have performed over historical data in just a few minutes. While powerful, you are still playing in the platform’s sandbox, which can limit complex logic and deep customization.
The goal isn’t to find the “perfect” software on day one. It’s to find the right tool for your current skill level and the specific strategy you want to test. Don’t let the search for a perfect tool become a form of procrastination. Start simple, validate an idea, and then evolve.
The Ultimate in Flexibility: Coded Solutions
For traders who need absolute control and limitless customization, a fully coded solution is the final destination. Using a programming language like Python along with specialized libraries such as Backtrader or Zipline gives you unparalleled power. You can build any logic imaginable, run sophisticated statistical analyses, and automate your entire workflow.
The power of this approach is undeniable. For instance, you can model complex historical scenarios with incredible precision. A practical example is testing a simple 200-day moving average crossover strategy on the S&P 500 index (SPY). Using historical data from 2000 to 2020, a coded backtest could reveal not just the overall profit, but also how the strategy performed during major events like the 2008 financial crisis and the 2020 COVID crash. This level of detail — which is difficult to achieve with simpler tools — shows how a programmatic backtest can uncover a robust edge over decades.
Of course, this path has the steepest learning curve. It requires programming knowledge and a solid grasp of data structures. But the time invested pays off by giving you the freedom to test any idea you can dream up, with no limitations. To help you weigh your options, our detailed comparison of the best backtesting software can provide further clarity.
Here’s a simple breakdown to help you decide:
| Software Type | Best For | Learning Curve | Cost | Customization |
|---|---|---|---|---|
| Spreadsheets | Beginners testing simple, slow strategies. | Low | Free | Low |
| No-Code Platforms | Visual learners and rapid prototyping. | Medium | Freemium/Subscription | Medium |
| Coded Solutions | Quantitative traders needing total control. | High | Free (Open Source) | High |
Choosing your software is all about matching the tool to the task and — most importantly — to your current abilities. Start where you can be productive today, not where you hope to be in a year. The skills you build at each stage will become the foundation for the next.
How to Interpret Your Results and Avoid Deception
This is the moment of truth. After all that hard work sourcing data and running your backtest, you’re staring at a performance report. This is where your intellectual honesty becomes your most valuable trading asset.
It’s so easy to see a positive net profit and start dreaming of market riches. But the pros know that surface-level numbers can be dangerously misleading.
True interpretation isn’t about finding one magic number. It’s about understanding the story your metrics are telling you together. A high win rate feels great, but it’s almost meaningless on its own. A strategy that wins 80% of the time but loses big on the other 20% is just a fast track to a blown-up account. You have to look at a balanced scorecard.
The Essential Metrics That Tell the Real Story
Think of your backtest results as a health check for your strategy. You wouldn’t judge a person’s health by just their weight; you need to check their blood pressure, cholesterol, and other vital signs. The same is true for a trading system.
Here are the key metrics you need to dissect:
- Profit Factor: This is one of the most honest metrics out there. It’s simply the gross profit divided by the gross loss. A profit factor of 2.0 means you made two dollars for every one dollar you lost. Anything below 1.0 means you have a losing strategy, period.
- Sharpe Ratio: This measures your risk-adjusted return. In simple terms, it tells you how much return you’re getting for the amount of volatility (risk) you’re taking on. A higher Sharpe ratio suggests the strategy is more efficient at generating profits.
- Maximum Drawdown: This is the gut-check metric. It shows the largest peak-to-trough drop your account equity took during the test. If your strategy had a 50% maximum drawdown, ask yourself: could I emotionally handle watching half my account vanish without abandoning the system? For a deeper dive, check out our full guide on what maximum drawdown is and why it matters.
Together, these metrics paint a complete picture. A high profit factor with a terrifyingly large maximum drawdown points to a strategy that might be profitable but is too risky to actually trade. Your job is to find a balance that fits your personal risk tolerance.
Unmasking the Two Great Backtesting Villains
Even with solid metrics, your results can be completely bogus if you’ve fallen for one of two notorious backtesting traps. These errors are so common they’ve wiped out more trading accounts than almost any other mistake. Spotting them is non-negotiable.
The goal of a backtest is not to create the most beautiful equity curve on historical data. The goal is to honestly assess if a strategy has a genuine edge that is likely to persist in the future.
This means you must actively hunt for flaws in your own process. Your default mindset should be one of professional skepticism, constantly asking, “How could this be wrong?”
The Trap of Overfitting
Overfitting, or curve-fitting, is what happens when you tweak your strategy’s rules so much that it perfectly matches the historical data. The strategy has essentially “memorized” the past instead of learning a durable market pattern.
A practical example would be a moving average strategy where you test every possible combination of short and long averages from 1 to 200. You might find that a 13-day and a 49-day average produced amazing results on past AAPL data. This looks like a discovery, but it’s likely a random fluke that won’t work going forward. It’s been over-optimized.
The Danger of Lookahead Bias
Lookahead bias is more subtle but just as deadly. It happens when your backtest simulation uses information that wouldn’t have been available at the time of the trade.
A classic example is using the closing price of a candle to make a decision at the opening of that same candle. You are, in effect, trading with information from the future.
Your Shield Against Deception: Walk-Forward Analysis
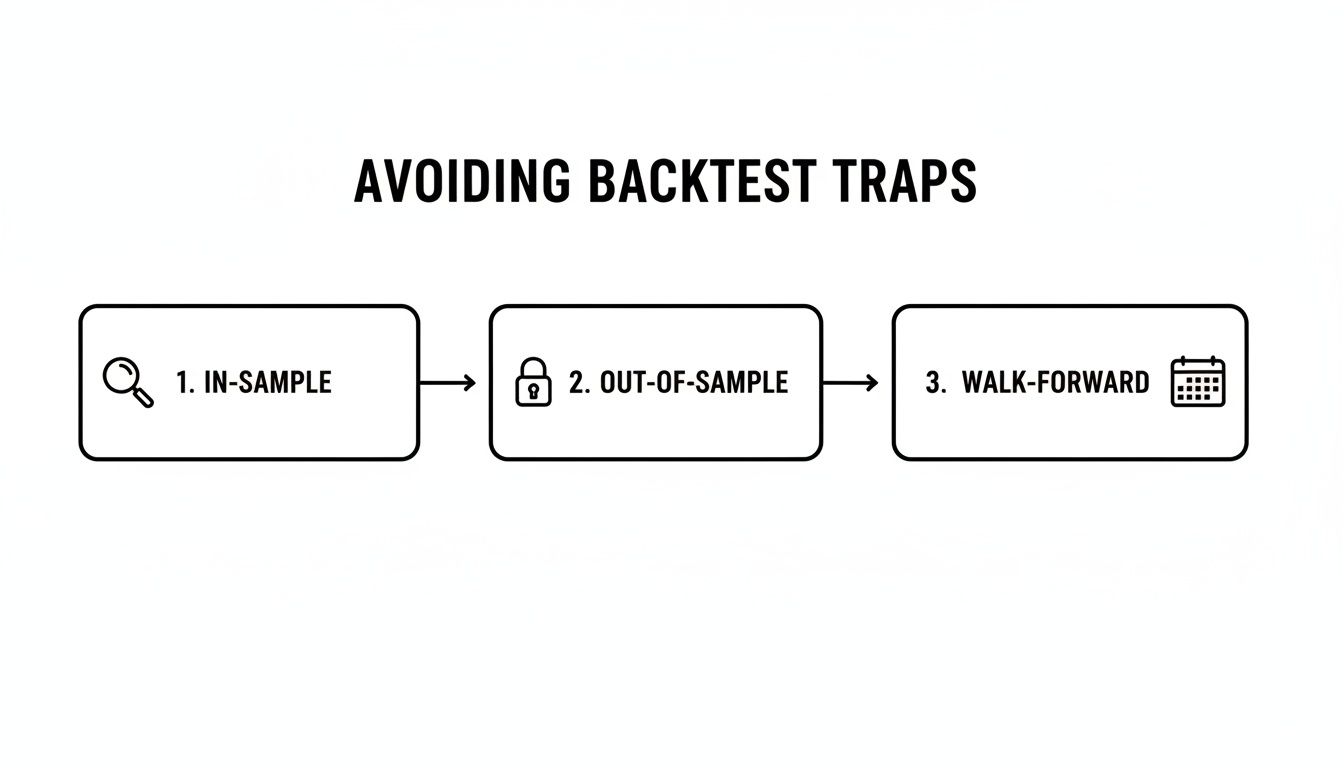
So, how do you protect yourself? The most robust defense is walk-forward analysis. This method rigorously validates your strategy by breaking your historical data into chunks.
Here’s the process:
- In-Sample Optimization: You take a portion of your data (e.g., the first two years) and find the best parameters for your strategy. This is your “training” period.
- Out-of-Sample Testing: You then apply the exact same strategy and parameters to the next chunk of data it has never seen before (e.g., the next six months). This is your “validation” period.
- Repeat: You slide this window forward through your entire dataset, repeatedly training on one period and validating on the next.
This process mimics how you would trade in real-time, forcing your strategy to prove it can adapt. If it performs consistently well across multiple out-of-sample periods, you can have much higher confidence in its robustness.
This validation is especially critical for certain strategies. Mean reversion systems, for instance, can produce fantastic backtests but are notoriously susceptible to curve-fitting. Using a walk-forward approach can create a much stronger alignment between backtest and forward performance. You can find more insights on smarter backtesting methods over at Financial Modeling Prep.
Transitioning from Backtest to Live Trading
You’ve poured countless hours into sourcing data, coding your logic, and poring over performance metrics. Finally, you have a backtested strategy that actually looks promising. It’s a huge milestone, but here’s the reality check: a great backtest isn’t the finish line. It’s the starting line.
The journey from the clean, theoretical world of a backtest to the messy, unpredictable reality of live markets is where most strategies fall apart. This is where your discipline as a trader is truly tested.
Why? Because live trading throws two huge variables into the mix that a backtest can never truly replicate: slippage and emotions. Anyone who’s made this jump knows the feeling — the hesitation before you click “buy,” the anxiety of holding an open position, the sting of a real loss. These psychological pressures can make you abandon a perfectly good plan in a heartbeat.
The Bridge to Live Markets: Paper Trading
Before you even think about risking real money, your first step should always be paper trading. And no, this isn’t just about re-running your backtest in real-time. It’s about testing yourself. Can you execute the strategy flawlessly when the market is moving?
Think of it as the final dress rehearsal. Your only goal is to follow your strategy’s rules with robotic precision. You’re trying to prove that you can handle the mechanics and the mental game of making decisions on the fly. You’ll quickly discover that getting the exact entry and exit prices your backtest assumed is a lot harder than it looks. This is your first real taste of market friction.
For anyone new to this, understanding what paper trading is and how to get started is a non-negotiable step. It’s the safest way to build the right habits before your capital is on the line.
Graduating to a Small, Real-Money Account
Once you’ve paper traded consistently and your results are lining up reasonably well with your backtest, it’s time to put some real skin in the game. Even if it’s just a few dollars per trade, the emotional dynamic shifts completely the second real money is at stake.
A backtest tells you how your strategy performed. Paper trading tells you if you can execute it. Small-stakes live trading tells you if you can handle the emotional pressure. Each step validates a different, critical component of your trading plan.
Starting small lets you experience the full emotional rollercoaster — fear, greed, hope, regret — without risking a catastrophic loss. This is where you truly learn to manage your psychology, honor your stop-losses, and trust your system, even during a drawdown. These are lessons a simulation can never teach you.
Creating the Continuous Feedback Loop
Your work doesn’t stop once you go live. In fact, it gets more intense. The key to long-term success is building a continuous feedback loop between your backtested expectations and your live performance. This is impossible without one crucial habit: meticulous trade journaling.
Every single trade, paper or live, has to be logged and analyzed. A detailed trading journal, like TradeReview, lets you track not just your P&L, but the “why” behind every decision. By tagging your setups, mistakes, and even your emotional state, you build an incredibly rich dataset on your own performance.
This is the kind of structured validation you need to build confidence that your strategy isn’t just a statistical fluke.
By consistently comparing your live results against your backtest, you can start answering the questions that really matter for your long-term survival:
- Is my live drawdown way worse than my backtest predicted? This could mean your model is flawed or the market has changed.
- Are slippage and commissions killing my profits? Your backtest might have been too optimistic on transaction costs.
- Am I missing entries or hesitating on trades? This points to an execution or psychological issue you need to fix.
Your trading journal becomes the bridge connecting your backtest to reality. It gives you the objective data you need to make smart adjustments, turning every trade into a valuable lesson. This cycle of monitoring, analyzing, and refining is what it truly means to build a sustainable edge in the markets.
Frequently Asked Questions About Backtesting
When you first dive into systematic trading, a bunch of questions always seem to surface. We’ve all been there. Feeling a little lost is just part of the process — it’s a sign you’re digging in and taking this seriously. Let’s tackle some of the most common hurdles traders face when they start to back test trading strategies.
How Much Historical Data Do I Need for a Reliable Backtest
This is easily one of the most common questions, and the honest answer is: it depends entirely on your strategy’s rhythm. There’s no magic number, but the guiding principle is this: your data has to be long enough to cover a wide variety of market conditions.
If you’re testing a long-term, trend-following strategy on a major index, you need to see how it held up through multiple economic cycles. We’re talking 10 to 15 years, minimum. This makes sure your strategy isn’t just a fair-weather friend that only works in a recent bull run.
On the other hand, a shorter-term mean-reversion strategy on a single volatile stock might only need five to seven years. The key is making sure that period includes times of both high and low volatility. The goal isn’t a specific number of years; it’s about capturing the different “personalities” the market can throw at your strategy.
My Backtest Looks Perfect Should I Expect the Same Results Live
It’s incredibly tempting to see a perfect, upward-sloping equity curve and start celebrating. But hold on. A healthy dose of professional skepticism is your best friend here.
The short answer is no, you should not expect the same results. A backtest is a simulation in a perfect, frictionless world.
Real trading is messy. It’s full of costs and delays that backtests often can’t model perfectly, like:
- Slippage: The price difference between when you click “buy” and when your order actually fills.
- Commissions: Brokerage fees that take a small bite out of every single trade.
- Data Latency: Tiny delays between a signal firing and your order reaching the exchange.
In fact, a “perfect” backtest is usually a massive red flag. It’s a classic sign of overfitting — where your rules are so finely tuned to past data that they’ve lost any real predictive power. Think of your backtest result as the absolute best-case scenario. A pro trader sees it as an upper limit and fully expects live performance to be lower.
What Is the Difference Between Backtesting and Paper Trading
This is a critical distinction that trips up a lot of new traders. They aren’t an either/or choice; they are two different tools for two different jobs. One follows the other.
Backtesting validates the idea. Paper trading validates the execution. Both are non-negotiable steps in the journey from theory to reality.
Backtesting is your high-speed historical lab. Its real power is crunching decades of data in minutes, giving you a statistical bird’s-eye view of your strategy’s potential. It answers the question: “Would this idea have worked in the past?” Its main weakness is the risk of hindsight bias and accidentally optimizing it to perfection.
Paper trading (or forward performance testing) is the bridge to the real world. You trade your strategy in a live market, tick-by-tick, but without any money on the line. It’s slow because it happens in real-time. It answers a much more personal question: “Can I actually execute this idea under pressure, and how do real-world frictions chew into its performance?”
This is where you’ll really feel the sting of slippage and find out if you have the discipline to stick to your rules when the market gets choppy. The professional workflow is always the same: first, find a statistical edge with a robust backtest. Then, prove you can capture that edge in a live environment through paper trading.
Ready to move from theory to practice? A solid backtest is your starting point, but meticulous journaling is how you refine your edge and build lasting discipline. TradeReview provides the tools you need to log every trade, analyze your performance with powerful analytics, and connect your backtested expectations to your real-world results. Start building your professional trading habits today, for free.