
The ascending triangle pattern is a classic bullish formation that hints at a potential breakout on the horizon. It’s defined by a flat, horizontal resistance line and a rising support trendline, which together show that buyers are getting more aggressive while sellers are holding their ground at a specific price. For traders feeling lost in market noise, this pattern can provide welcome clarity.
What Is the Ascending Triangle Pattern

Think of a powerful spring being squeezed tighter and tighter. With every push, it coils, storing up energy until it finally bursts with explosive force. The ascending triangle pattern behaves in much the same way — it’s a period of market consolidation where bullish energy builds up just before a potential price surge.
This setup is a well-regarded continuation pattern in technical analysis, usually appearing in the middle of a solid uptrend. It tells a clear story about the ongoing fight between buyers and sellers, often giving traders a high-probability roadmap for what could happen next. We’ve all struggled with market uncertainty; spotting this pattern can feel like finding a clear path forward.
The Two Core Components
At its core, the ascending triangle is made of two simple, converging trendlines. Understanding what each line represents is the first step to mastering this pattern.
-
The Horizontal Resistance Line: This is a flat ceiling drawn across the price highs. It’s where sellers consistently step in to cash out, stopping the price from pushing higher. This level marks a point of agreement among sellers about the asset’s current value.
-
The Ascending Support Line: This is an upward-sloping floor connecting a series of higher lows. It shows that buyers are getting more optimistic with each pullback. They’re willing to pay more and more, which signals growing confidence and stops the price from dipping too far.
The real action happens where these two lines start to squeeze together. As the price bounces between the fixed ceiling and the rising floor, the trading range gets tighter. This compression often indicates that a significant move is just around the corner.
This visual narrative reveals a market where buyers are growing more aggressive, willing to pay higher prices, while sellers hold firm at a specific level. The tightening range is the market holding its breath before the next major move.
For quick reference, here’s a breakdown of the pattern’s key characteristics.
Ascending Triangle Pattern Quick Reference Guide
| Characteristic | Description | What to Look For |
|---|---|---|
| Pattern Type | Bullish Continuation | Forms during an existing uptrend and signals more upside. |
| Trendlines | Two converging lines | A flat horizontal resistance line and a rising support line. |
| Market Psychology | Buyers Gaining Strength | Higher lows show buyers are willing to pay more on each dip. |
| Volume Behavior | Decreasing then Spiking | Volume tends to fade during formation, then spikes on the breakout. |
| Breakout Signal | Price Pierces Resistance | A decisive close above the horizontal resistance line. |
| Reliability | Generally High | Considered one of the more reliable continuation patterns. |
This table serves as a handy cheat sheet, but the real power comes from understanding the why behind the pattern.
Why It Matters for Traders
An ascending triangle isn’t just a random shape on a chart; it’s a picture of market psychology in action. It signals a subtle but powerful shift from sellers to buyers. At first, sellers are in control at the horizontal resistance, but the series of higher lows proves their grip is slipping as buyers relentlessly push the price up.
When the price finally smashes through that resistance — especially with a big jump in trading volume — it’s a confirmation that the buyers have won the battle. This breakout often kicks off a strong, fast move upward, creating a clear trading opportunity.
While no pattern can guarantee profits, the ascending triangle’s logical structure and historical performance make it a cornerstone of many trading strategies. It helps cut through the market noise and points to high-probability setups with clearly defined risk.
The Market Psychology Behind the Pattern
To really get a feel for the ascending triangle pattern, you have to look beyond the lines on the chart. What you’re actually seeing is a story unfolding — a visual record of a fierce tug-of-war between buyers and sellers. It’s more than just a shape; it’s pure market psychology in action.
The flat, horizontal resistance line is the sellers digging their heels in. It’s a price level where a group of traders has decided, “This is as high as it goes for now.” They see the asset as fully valued or even overvalued.
Every time the price bumps its head against this ceiling, sellers step in to cash out or open short positions. This supply is what creates that clean, flat top — a clear psychological barrier that has to be broken.
The Rising Tide of Buyer Conviction
While sellers are holding the line, the buyers are telling a totally different story. That ascending support line, built on a series of higher lows, is where the real action is. It’s arguably the most important part of the pattern.
It shows that with each dip, buyers are getting more aggressive. They’re jumping in sooner and at higher prices, refusing to let the price fall back to where it was before. This is a tell-tale sign that demand is quietly but systematically starting to overpower supply.
This dynamic screams increasing buyer conviction. They see value, and they’re willing to pay up for it, absorbing wave after wave of selling pressure and pushing the price floor higher and higher.
The ascending triangle pattern captures that moment of compression where bullish determination slams into a fixed wall of supply. The rising floor of higher lows shows that the buyers’ resolve is growing stronger, making an eventual push through the ceiling more and more likely.
We’ve all been there — watching a stock hit a price ceiling and wondering if it has the strength to push through. The ascending triangle gives us a narrative to follow, turning that raw uncertainty into a structured analysis of market forces.
The Significance of Declining Volume
There’s one more piece to this psychological puzzle: trading volume. As the triangle forms and the price action gets squeezed, you’ll usually see volume start to dry up. This isn’t a sign of boredom; it’s the market holding its breath.
Think of it like the quiet before the storm. The initial back-and-forth between buyers and sellers settles into a holding pattern as both sides wait for a decisive winner to emerge. This dip in volume shows a temporary truce before the final, powerful move.
- Decreasing Volume: During the coil, fading volume suggests traders are hesitant to commit inside the tightening range. They’re waiting for a clearer signal.
- Surging Breakout Volume: The breakout above resistance should be accompanied by a significant spike in volume. This surge is the confirmation — it’s the cavalry of buyers rushing in, validating the pattern and fueling the next leg up.
When you put it all together, the price action and volume tell a complete story. It’s the narrative of a battle where one side slowly gains ground before launching a final, decisive attack. Understanding this psychology is what separates a mechanical chart-watcher from a trader who can actually feel the market’s pulse.
How to Identify and Validate the Pattern
Spotting an ascending triangle on a chart can feel like finding a clear signal in a sea of market noise. But let’s be real — not every triangle is a high-probability setup. To avoid getting faked out, you need a disciplined eye and a strict set of rules to filter out the misleading formations.
It all starts with context. An ascending triangle is a bullish continuation pattern, which means it should ideally appear during an existing uptrend. Think of it as the market taking a quick breather to consolidate gains before mustering the strength for its next leg up. If you see one forming in a choppy or downtrending market, approach it with extra caution.
The Anatomy of a Valid Pattern
Once you’ve confirmed an uptrend, it’s time to draw the two critical trendlines. This isn’t abstract art; these lines have to connect specific price points to be valid.
-
The Horizontal Resistance Line: Draw a flat line connecting at least two relatively equal price highs. These peaks show you the exact price ceiling that sellers are digging in to defend. The more touches, the stronger and more significant that resistance level is.
-
The Ascending Support Line: Now, draw an upward-sloping line connecting at least two higher lows. This rising floor shows increasing buyer aggression. Each higher low proves that buyers are stepping in earlier and with more conviction, preventing the price from dipping back to its previous lows.
The pattern is only confirmed once you have a minimum of two touches on the top resistance line and two on the bottom support line. This structure — the flat top and the rising bottom — is the classic signature of building bullish pressure.
Volume: The Ultimate Confirmation Tool
Price action tells one side of the story, but volume tells you the rest. It’s a powerful tool for revealing the conviction behind price moves. A valid ascending triangle will almost always have a predictable volume signature.
First, as the price coils tighter between the two trendlines, trading volume should gradually dry up. This tapering volume shows that the market is reaching a tense equilibrium. Both buyers and sellers are becoming less active as they wait for a decisive move. It’s the market holding its breath.
Then comes the breakout. It should be accompanied by a significant surge in volume. This part is non-negotiable. A breakout that limps over the resistance line on weak, anemic volume is highly suspect and has a much greater chance of failing. A powerful volume spike, on the other hand, signals that other traders are likely behind the move, providing the fuel needed for a sustained rally.
A breakout without volume is just noise. A breakout with a massive volume spike is a clearer signal of conviction — and that’s the move you want to be a part of.
This volume behavior is what separates the high-probability setups from the weaker ones. While no pattern is perfect, historical analysis suggests that ascending triangles tend to resolve upward more often than not. The key is patience and discipline.
Finally, pay attention to the pattern’s timeline. Ascending triangles can form over any period, from a few days on an intraday chart to several months on a weekly one. However, the breakout usually happens somewhere between the halfway and three-quarters point of the triangle’s length. If the price just meanders all the way to the apex (where the lines converge) without a breakout, the pattern has likely lost its predictive power.
You can learn more about testing pattern reliability in our guide on how to backtest a trading strategy. By sticking to these validation rules, you can dramatically improve your accuracy and trade with much greater confidence.
Actionable Trading and Risk Management Rules
Spotting a high-probability ascending triangle pattern is a great start, but it’s only half the job. To turn that pattern into a potential trading opportunity, you need a rock-solid, rule-based plan. This means knowing exactly when to get in, where to cash out, and — most importantly — where to cut your losses if the trade turns against you.
Trading without a plan is a recipe for emotional decisions. The rules below are designed to take emotion out of the equation, helping you trade the pattern with discipline and precision. This kind of structured approach is what separates long-term, successful traders from everyone else.
Pinpointing Your Entry Trigger
Impatience is the enemy of profit. Many traders, terrified of missing the move, jump the gun and buy the second the price pokes its head above the resistance line. This is a classic mistake that often gets you caught in a “fakeout” — where the price pops up for a moment only to come crashing back down.
A much smarter, more disciplined approach is to wait for real confirmation. Your entry trigger should be a decisive candle close above that horizontal resistance level. A solid close confirms that buyers were strong enough to hold the price above that key psychological barrier for an entire session, signaling genuine momentum.
Even better, that breakout candle should come with a significant surge in volume. Big volume is the ultimate validator; it shows you that other market participants are likely fueling the move. Waiting for these two things — a strong close and a volume spike — filters out the weak signals and can help stack the odds in your favor.
The diagram below breaks down the simple, three-step process for identifying a valid setup before you even think about placing a trade.
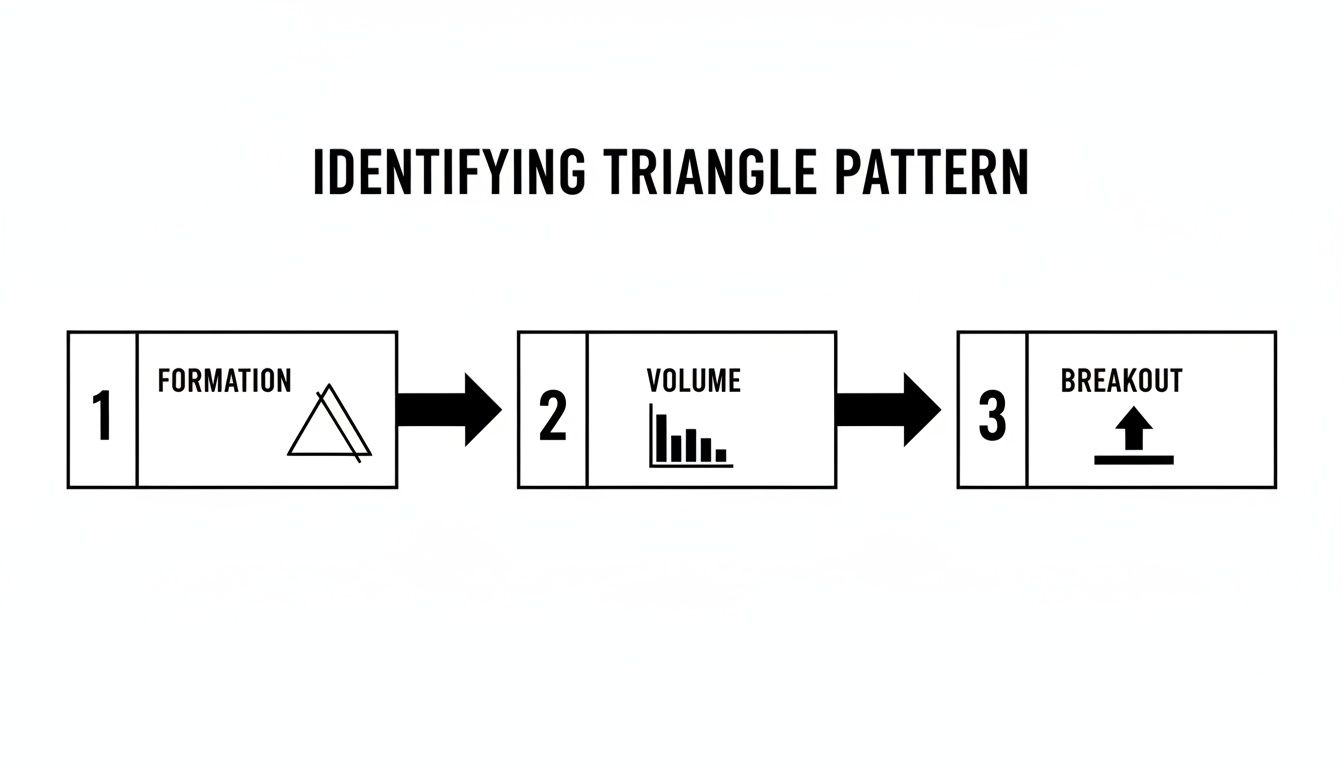
As you can see, a valid pattern and shrinking volume must come before the high-volume breakout. This is what sets the stage for a powerful entry.
Setting a Logical Profit Target
Once you’re in the trade, you need an exit plan. The ascending triangle gives us a logical and objective way to set a profit target, removing much of the guesswork.
The standard method is called the measured move technique. Here’s how it works:
- Measure the Height: Calculate the vertical distance from the horizontal resistance line down to the lowest point of the ascending support line. This is the triangle’s maximum height.
- Project from the Breakout: Take that height and add it to the price where the breakout occurred.
- Set Your Target: That resulting price level is your primary profit target.
Practical Example: Imagine a stock forms an ascending triangle. The resistance is at $50 and the lowest point of the support line is at $45. The height is $5. If the stock breaks out and closes at $50.50, you would add the $5 height to that price. Your profit target would be around $55.50.
This technique is built on a simple idea: the energy that was coiled up during the consolidation is likely to unspool in a move of similar size. It gives you a data-driven target, helping you sidestep the emotional traps of greed and fear.
Implementing Non-Negotiable Risk Management
Okay, this is the most critical part of your entire trading plan. No pattern works 100% of the time, and the ascending triangle can and will fail. Your long-term survival in this game depends entirely on how you manage your risk when a setup goes wrong.
Your stop-loss is your safety net, and you need to place it at a logical level that proves your bullish idea was wrong. For the ascending triangle, a logical spot for a stop-loss is just below the ascending support trendline. If the price breaks below this rising floor, it’s a clear signal that buyers have lost control and the pattern has failed.
Placing your stop here does two things perfectly:
- It gives the trade enough room to wiggle around without getting stopped out by normal market noise.
- It gets you out immediately if the entire reason for the trade — building buying pressure — is no longer true.
By defining your entry, target, and stop-loss before you ever click “buy,” you create a trade with a favorable risk-to-reward ratio. This disciplined approach is the true foundation of a professional trading career. To go deeper on this, check out our complete guide on risk management for traders.
When the Pattern Fails and How to React

It’s an easy trap to fall into. You spot a perfect ascending triangle pattern, the volume is coiling, and you start mentally counting your profits before the breakout even happens. But in trading, nothing is ever guaranteed. Every seasoned trader has felt the sting of a picture-perfect setup falling apart, and the ascending triangle is no exception.
Understanding and preparing for failure is just as crucial as planning for a win. Treating this pattern as a foolproof bullish signal is a dangerous oversimplification. While it certainly has a bullish bias, a breakdown can and does happen — often leading to a move that is surprisingly swift and severe.
The Bearish Breakdown Scenario
The real danger here is the psychology of the trapped trader. As buyers confidently step in at higher and higher lows, they’re placing a collective bet on an upward breakout. Their stop-loss orders naturally begin to cluster just below that ascending support trendline, creating a pocket of potential selling pressure.
When the price unexpectedly breaks down through that rising floor, it can trigger a domino effect. The stop-loss orders of all those optimistic buyers get hit one after another, forcing them to sell their positions at a loss. This sudden flood of sell orders adds intense downward momentum, turning a simple pattern failure into a sharp, painful plunge.
A breakdown below the rising support line, especially on a spike in volume, is a powerful bearish signal. It represents a complete reversal of market sentiment, where trapped buyers are forced to liquidate and fuel a rapid downward move.
Comprehensive analyses show the ascending triangle pattern isn’t exclusively bullish. According to sources like the bearish side of the ascending triangle pattern on Tickeron.com, downward breakouts can occur. These failures can be particularly aggressive as trapped bulls are forced to panic-sell.
Strategies for Managing a Failed Pattern
How you react when a pattern fails is what separates disciplined traders from those who blow up their accounts. Your gut reaction will be to hold on and hope for a recovery, but your trading plan must be smarter than your emotions.
Here’s a practical, rule-based approach for handling a failure:
-
Respect Your Stop-Loss Unconditionally: We talked about setting your stop-loss just below the ascending trendline. If the price hits this level, the trade is invalidated. No negotiation. You must exit immediately to protect your capital. Hesitation is the fastest way to turn a small, manageable loss into a devastating one.
-
Analyze the Breakdown Volume: A breakdown on a big spike in volume carries much more weight. It confirms strong bearish conviction and suggests the downward move has legs. A low-volume dip might just be a temporary shakeout, but a high-volume breach is a clear warning sign to get out.
-
Consider Flipping Your Bias: For more advanced traders, a confirmed breakdown can present an entirely new opportunity — a short trade. If the price closes decisively below the support line on high volume, you could consider entering a short position. Your stop-loss would then go just above that now-broken support line, which often acts as new resistance.
Embracing the possibility of failure isn’t pessimistic; it’s what professionals do. By having a clear and actionable plan for when an ascending triangle breaks down, you protect your capital and maintain the discipline needed for long-term trading success.
Refining Your Strategy with a Trading Journal
Spotting a chart pattern is one thing. Consistently profiting from it is another game entirely. Knowing the textbook definition of an ascending triangle is a great start, but true mastery comes from tracking your own performance with obsessive detail. This is where a trading journal becomes the most important tool in your arsenal.
It’s just human nature to remember the big wins and conveniently forget the trades that went south. But that emotional bias can be devastating for your account. A trading journal brutally replaces feelings with facts. It turns your trading from a string of isolated hunches into a structured business, forcing you to see what’s actually working, what isn’t, and why.
Turning Knowledge into Profitability
The real goal here is to build a feedback loop powered by your own data. Every time you log a trade — especially your ascending triangle setups — you’re building a personal database of your own performance. You’ll finally move beyond theory and start analyzing your actual edge in the market.
A dedicated tool like TradeReview makes this process painless. Instead of wrestling with clunky spreadsheets, you can log trades in seconds and use tags to slice and dice your data. For instance, you could tag every trade with labels like:
- #AscendingTriangleBullish: For the clean breakouts that followed your plan.
- #AscendingTriangleFailed: For the ones that broke down and stopped you out.
- #VolumeConfirmation: To keep track of trades that had that classic volume spike on the breakout.
Here’s a glimpse of what a performance dashboard can look like inside a proper journal. It gives you a clean, unbiased overview of your most important stats.
This kind of dashboard gives you an instant, data-rich snapshot of your P&L, win rate, and profit factor — all without the emotional baggage.
Analyzing Your Personal Edge
Once you’ve logged a decent number of trades, you can run reports specifically on your ascending triangle strategy. This is where the lightbulb moments happen. You can finally get concrete answers to the questions that have been nagging you.
A trading journal transforms you from a pattern spotter into a strategic analyst of your own behavior. It’s the single most effective tool for identifying weaknesses, building on strengths, and systematically refining your market edge.
This process shines a spotlight on where you need to improve. Maybe you discover your win rate is amazing, but your risk-to-reward ratio is terrible. Or maybe you realize you’re constantly jumping into trades too early. This is the specific, actionable feedback that separates the pros from the amateurs.
If you want to start from the ground up, our guide on creating a trading journal template in Excel can help you grasp the core concepts. Ultimately, this disciplined habit of logging and reviewing is what bridges the gap between knowing the theory and banking real, consistent profits.
Frequently Asked Questions
Even with a solid grasp of the basics, a few specific questions always pop up when you start trading a new pattern. Let’s tackle some of the most common ones to clear up any lingering confusion and get you trading ascending triangles with more confidence.
What’s the Difference Between an Ascending Triangle and a Symmetrical Triangle?
The real difference comes down to market psychology, which you can read right off the trendlines. An ascending triangle has a flat, horizontal resistance line. This tells you sellers are digging in their heels at a specific price, refusing to budge. But at the same time, the rising support line shows buyers are getting more aggressive with each dip, creating a clear bullish pressure cooker.
A symmetrical triangle, on the other hand, has both a descending resistance line (lower highs) and an ascending support line (higher lows). It’s the visual definition of indecision. Neither buyers nor sellers have the upper hand, and the market is just coiling up. The breakout could go either way, making it less predictable than the bullish bias of the ascending triangle.
What Timeframe Is Best for Trading This Pattern?
The ascending triangle is what we call a fractal pattern — it shows up everywhere, from the lightning-fast 1-minute chart all the way out to the weekly. That said, its reliability tends to get a lot better on higher timeframes. A pattern that takes weeks or months to form on a daily chart represents a much more significant and hard-fought battle between bulls and bears.
Patterns on longer timeframes like the daily or weekly charts are often considered more significant because they reflect the actions of a larger pool of market participants. While the pattern is still viable for day trading on shorter timeframes, traders must be more vigilant about market noise and the higher likelihood of false breakouts.
How Important Is Volume for Confirming a Breakout?
It’s not just important; it’s absolutely critical. Think of volume as the fuel in the tank. A breakout that happens on weak or dying volume is a huge red flag. It’s like a car sputtering to a start — it suggests there’s no real conviction behind the move, and it’s more likely to fail and trap hopeful buyers.
What you want to see is a massive surge in volume the moment the price punches through that horizontal resistance. A spike of 50% or more above the recent average volume is a fantastic sign. It tells you other traders and institutions are likely jumping in, which dramatically increases the odds of a strong, sustained follow-through.
A breakout without volume is a warning. A breakout with volume is confirmation.
Ready to stop guessing and start analyzing? The fastest way to master the ascending triangle pattern is to meticulously track your own trades. TradeReview gives you the tools to log, tag, and break down every setup, turning your trade history into actionable intelligence. Sign up for free and find out what your data is telling you.


