
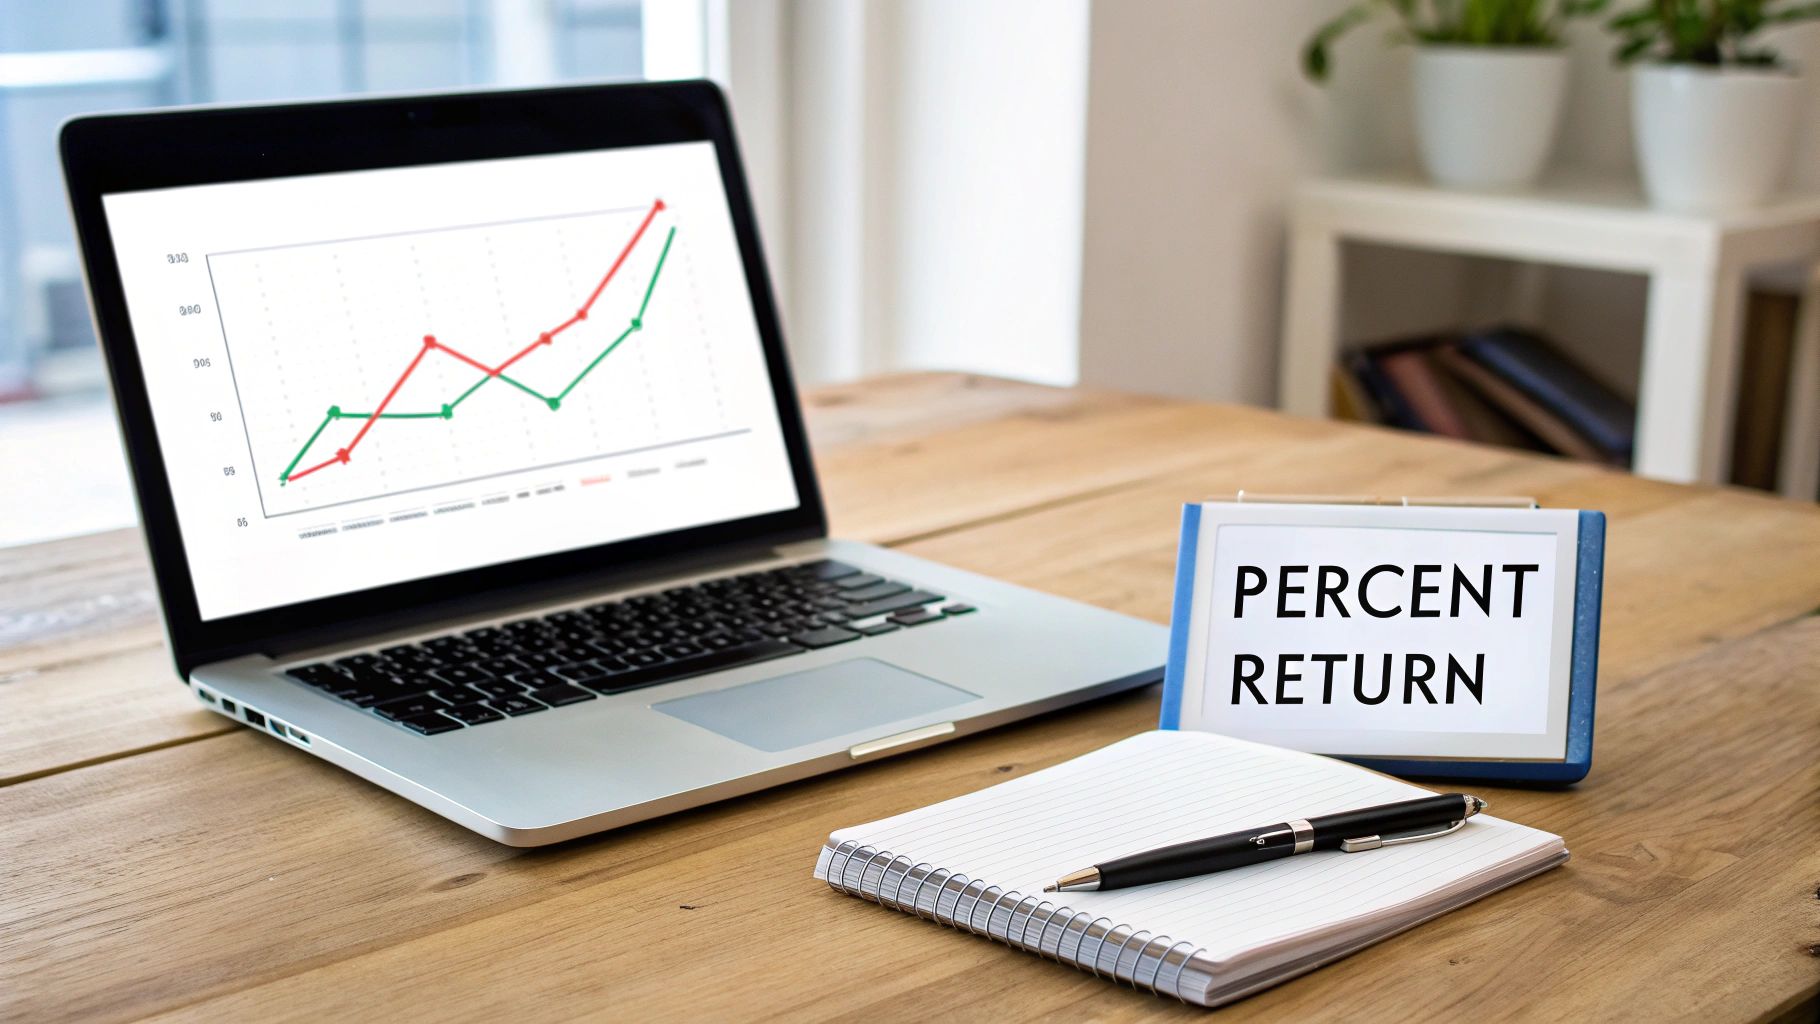
Calculating percentage return is how you measure the gain or loss on an investment compared to what you originally put in. To get it, you just subtract the starting value from the final value, divide that by the starting value, and then multiply by 100. It sounds simple, but this number is the single most important metric for understanding your real performance as a trader.
Why Percentage Return Is Your Most Important Metric
It’s easy to get fixated on dollar amounts. A $500 profit feels great, and a $200 loss definitely stings. We’ve all been there. But those numbers alone don’t tell you the whole story.
Was that $500 profit made on a $1,000 investment or a $50,000 one? The context changes everything. That’s where percentage return cuts through the noise and gives you the most honest measure of your success.
Percentage return is the universal language of performance. It levels the playing field, letting you compare a small options trade with a large stock position on equal footing. It’s how you move past emotional reactions and start making objective, data-driven decisions.
Gaining Clarity in Your Trading
When you consistently track your returns, you get a clear, unbiased look at how effective your trading strategy really is. This discipline is what separates casual traders from those who build long-term consistency. Instead of guessing what works, you’ll know.
Focusing on percentages helps you:
- Compare Apples to Apples: Evaluate every trade, no matter its size, to see which setups generate the best relative gains.
- Benchmark Your Performance: Objectively measure your strategy against market indices like the S&P 500 to see if your efforts are truly paying off.
- Understand Real Growth: See how your portfolio is compounding over time, moving beyond the distraction of daily P&L swings.
By focusing on the process of calculating percentage return for every single trade, you shift your mindset from chasing dollar signs to building a consistently profitable system. This is a subtle but powerful change that fosters discipline and long-term thinking.
Setting a Realistic Benchmark
Knowing how the broader market is doing gives you crucial context. For instance, according to official data, the S&P 500 has delivered a strong average annual return over the last decade. For active traders, this isn’t just a number — it’s a benchmark.
Calculating your own percentage return lets you see if your strategy is actually outperforming a simple “buy and hold” approach. If you’re not beating the market over the long run, it may be a sign to re-evaluate your strategy. It’s a tough question to ask, but a necessary one for growth. You can dig deeper into historical stock market returns to understand these long-term trends.
Ultimately, tracking your percentage return isn’t about vanity metrics. It’s about clarity, honesty, and strategic improvement.
Calculating Simple Returns on Your Individual Trades
Before we get into complex portfolio analysis or comparing our performance against the S&P 500, we have to start with the basics. The fundamental building block of performance tracking is the simple percentage return on a single trade. This is the clearest, most immediate feedback you can get on any trading decision.
The formula itself is pretty simple, but applying it with discipline is where the real power lies.
Simple Percentage Return = ((Ending Value – Beginning Value) / Beginning Value) * 100
This calculation shows you exactly how much you gained or lost relative to the capital you actually put at risk. It’s the first step to building an honest and accurate picture of your trading performance, which is essential for figuring out which of your strategies are really working.
The Nuances That Matter Most
It’s tempting to just look at a stock’s price change and call that your return. Honestly, this is one of the most common and costly mistakes traders make. Your true return has to account for every single transaction cost.
Your Beginning Value isn’t just the share price; it’s your total cost basis. This includes:
- Purchase Price: The price per share multiplied by the number of shares.
- Commissions: Any fees your broker charged to execute the buy order.
- Other Fees: Don’t forget any regulatory or exchange fees that might apply.
Likewise, your Ending Value is what you walk away with after selling. That means you have to subtract any commissions and fees tied to the sale. Ignoring these costs will inflate your returns and paint a dangerously inaccurate picture of your profitability. Over hundreds of trades, these “small” costs add up in a big way.
A Practical Stock Trading Example
Let’s walk through a real-world scenario to see how this plays out. Imagine you buy 50 shares of Company XYZ at $150 per share.
- Initial Cost: 50 shares * $150/share = $7,500
- Commission to Buy: Your broker charges a flat $5 fee.
- Total Beginning Value: $7,500 + $5 = $7,505
A few weeks later, the stock climbs to $162, and you decide it’s time to sell.
- Sale Proceeds: 50 shares * $162/share = $8,100
- Commission to Sell: Another $5 fee from your broker.
- Net Ending Value: $8,100 – $5 = $8,095
Now, let’s plug these true values back into our formula for calculating percentage return:
Return = (($8,095 – $7,505) / $7,505) * 100 = 7.86%
If you had ignored the $10 in commissions, you would’ve calculated an 8% return. While that might not seem like a huge difference on one trade, making this kind of accuracy a non-negotiable habit is what separates casual traders from serious ones.
Applying the Formula to Options
The exact same principle applies to other instruments, like options contracts. The key is to always, always focus on the total capital you spent versus the net capital you got back.
Let’s say you buy one options contract (which controls 100 shares) for a premium of $3.00 per share.
- Initial Cost: $3.00/share * 100 shares = $300
- Commission to Buy: Let’s assume a typical fee of $0.65 per contract.
- Total Beginning Value: $300 + $0.65 = $300.65
The trade goes your way, and you sell the contract when the premium hits $4.50.
- Sale Proceeds: $4.50/share * 100 shares = $450
- Commission to Sell: Another $0.65 fee.
- Net Ending Value: $450 – $0.65 = $449.35
Now for the final calculation:
Return = (($449.35 – $300.65) / $300.65) * 100 = 49.46%
This meticulous approach is the bedrock of solid performance tracking. To see how this fits into the bigger picture of your overall investment strategy, check out our guide on how to calculate return on investment. It all starts with getting the basics right, every single time.
Understanding Your Performance Over Time with Annualized Returns
A 10% return looks great on paper, but the timeframe you achieve it in changes everything. Nail a 10% gain in a single month? That’s incredible. But if it takes you five years to earn that same 10%? That’s a totally different story — you’ve likely underperformed even the most basic market index.
This is precisely why simple returns can be so misleading. To really understand your performance and compare different strategies fairly, you need to standardize your results. This is where annualized returns become one of the most powerful tools in your trading arsenal.
Annualizing a return is just a way of converting a gain or loss from any period — whether it’s 45 days or 15 months — into its equivalent yearly rate. This simple step creates a true apples-to-apples comparison, helping you see which strategies are actually building sustainable growth over the long haul.
Why Annualizing Is Crucial for Discipline
We’ve all felt the rush of a quick, profitable trade. It’s easy to get caught up in those short-term wins and start believing a strategy is better than it really is. But disciplined traders know that long-term success is built on consistency, not just the occasional home run.
Calculating annualized returns forces you to take a more patient, long-term view. It shifts your focus from the thrill of one trade to the sustainable performance of your entire strategy.
Think of it like a car’s miles per hour (MPH). It doesn’t matter if one car travels for 10 minutes and another for two hours; MPH gives you a standard way to compare their speed. Annualized return does the exact same thing for your investments.
This single metric helps you answer critical questions:
- Is my day-trading strategy actually generating a better annual return than a simple buy-and-hold ETF?
- How does that trade I held for three months stack up against the one I held for over a year?
- Am I on track to hit my long-term financial goals with my current performance?
Without annualizing, you’re essentially flying blind. With it, you’re making informed, strategic decisions.
How to Calculate Annualized Returns
Let’s walk through the calculation with a real-world example. Imagine you put $10,000 into a stock and sold it 15 months later for $12,000, after all fees.
First, you need the simple percentage return for the entire holding period:
Simple Return = (($12,000 – $10,000) / $10,000) * 100 = 20%
A 20% return is solid. But since it took you over a year to get it, the annualized figure will be lower. To find it, we need to figure out how many “years” the investment was held. Since there are 12 months in a year, the holding period is simply 15 / 12 = 1.25 years.
Now, we can plug everything into the annualization formula:
Annualized Return = ((1 + Simple Return) ^ (1 / Number of Years)) – 1
Let’s break it down with our numbers:
- Add 1 to your simple return (in decimal form): 1 + 0.20 = 1.20
- Calculate the exponent: 1 / 1.25 years = 0.8
- Raise the result from step 1 to the power of the exponent: 1.20 ^ 0.8 ≈ 1.157
- Subtract 1 and turn it into a percentage: (1.157 – 1) * 100 = 15.7%
So, your 20% return over 15 months works out to an annualized return of 15.7%. This is the number you can now fairly compare against benchmarks like the S&P 500 or the returns from your other trades.
The Magic of Long-Term Compounding
Once you start thinking in annualized returns, you naturally begin to appreciate the power of compounding. Compounding is the engine that makes your investment returns start generating their own returns. It feels slow at first, but over time, it creates a massive snowball effect on your portfolio’s growth.
This isn’t just theory; it’s a proven wealth-building machine. Just look at the S&P 500. For decades, it has delivered an average annual return of around 10% with dividends reinvested. This history shows how consistent, positive returns can transform even a modest investment into significant wealth over decades. To dig deeper into this, you can find more great insights on the average stock market return on Experian.com.
By focusing on achieving a solid annualized return and letting it compound, you’re tapping into one of the most fundamental principles of disciplined, long-term investing.
How to Measure Your Total Portfolio Performance
Figuring out the return on a single trade is pretty simple. But what about your entire portfolio? This is where things get tricky, especially when you’re adding or withdrawing cash, which constantly changes your account balance.
It’s a common headache. Let’s say you deposit $2,000 into your account. A week later, your portfolio is up $500. Did you just nail a 25% return on that new cash, or did your existing positions just have a great week? To answer that honestly, we have to move beyond the basic return formulas.
To get a true picture of your performance, you need to look at two professional-grade methods that handle these cash flows: the Time-Weighted Return (TWR) and the Money-Weighted Return (MWR). Knowing the difference between them is the key to accurately judging your trading skills.
Time-Weighted Return (TWR): The Strategy Judge
Think of the Time-Weighted Return as the purest measure of your investment strategy’s performance. It completely strips out the effects of when you add or pull money from your account.
The TWR calculation works by breaking down your performance into separate periods, with each deposit or withdrawal marking the end of one period and the start of another. By calculating the return for each little period and then linking them all together, TWR shows you how well your underlying investments did, totally separate from your decisions to add or remove funds.
TWR answers one critical question: “How well did my investment selections perform?” This makes it the perfect metric for comparing your results to a benchmark like the S&P 500 because it creates a level playing field for your strategy.
This is exactly how mutual fund managers are judged. They can’t control when investors pour money in or cash out, so their performance is based solely on how well they manage the assets they have. TWR reflects that skill, and that skill alone.
Money-Weighted Return (MWR): The Personal Scorecard
The Money-Weighted Return, on the other hand, is all about your personal journey. It calculates your return based on your specific cash flow decisions. The timing and size of your deposits and withdrawals have a huge impact on the final number.
At its core, MWR is an Internal Rate of Return (IRR) calculation. This method, sometimes called dollar-weighted return, tells you the exact return you actually earned on the capital you had at work.
This means if you got lucky and deposited a big chunk of cash right before a market rally, your MWR will look amazing. But if you withdrew a significant amount just before a major run-up, your MWR will show the sting of that missed opportunity. It measures not just your stock-picking ability, but also your market timing with your own money.
A Simplified Example: TWR vs. MWR in Action
Let’s walk through a scenario to see how these two metrics can paint very different pictures with the exact same portfolio.
Imagine you start the year with $10,000.
- At the 6-month mark: The portfolio has grown to $11,000 (a clean 10% gain). Feeling good, you decide to add another $11,000, bringing your total account balance to $22,000.
- By the end of the year: The market turns sour, and your $22,000 portfolio drops to $20,000. That’s a -9.09% loss during the second half of the year.
How TWR sees it:
TWR isolates the performance of each period, ignoring your deposit.
- Period 1 Return (first 6 months): +10%
- Period 2 Return (last 6 months): -9.09%
Your annual TWR comes out to -0.01%. This tells you that, net-net, your investment choices for the year were basically flat.
How MWR sees it:
MWR absolutely cares that you added more money right before a downturn. Your personal return was hit harder because you had more capital at risk during the losing period. The MWR calculation is a bit more complex (you’d typically use a spreadsheet), but in this case, your annual MWR would be roughly -4.7%.
This process of breaking down performance is what allows for standardized comparisons over different timeframes.
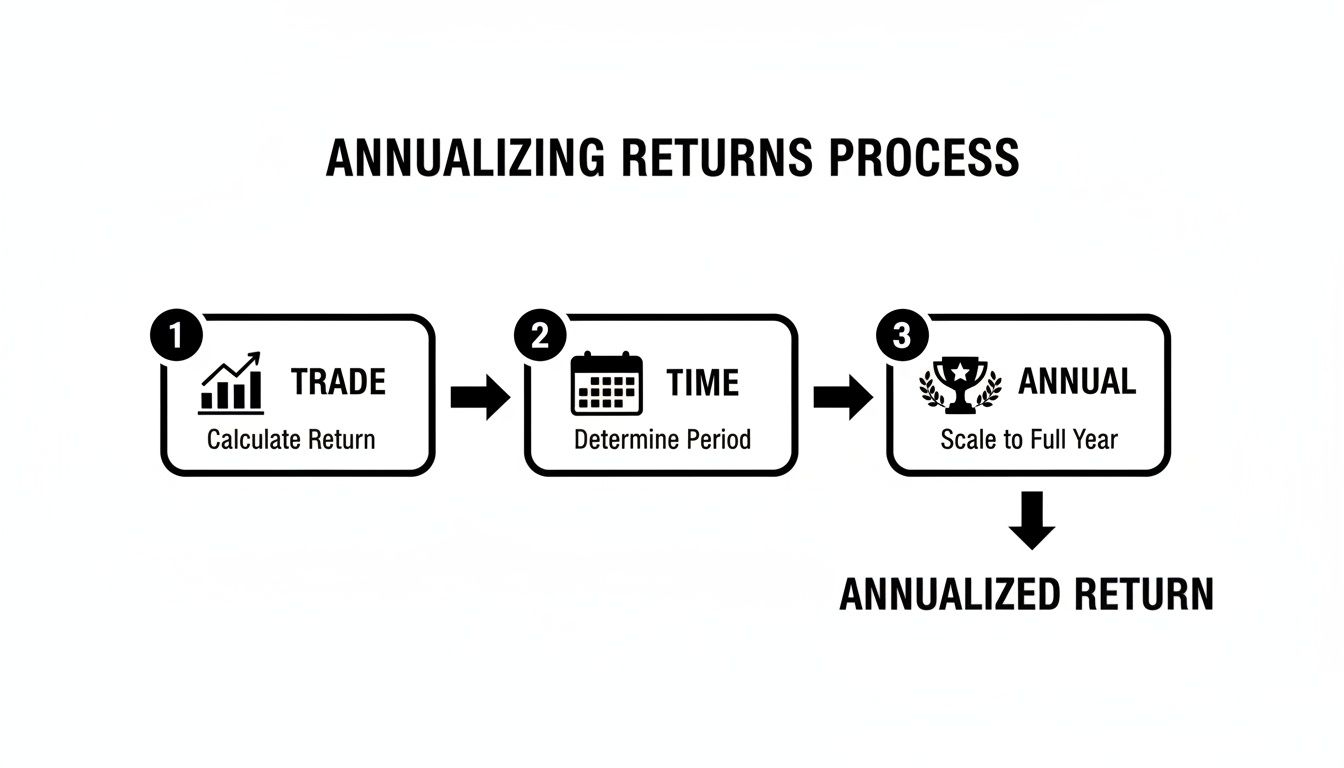
The flowchart above illustrates the core idea behind standardizing returns, which is fundamental to how TWR works — you measure the return between each cash flow and then chain those periods together to get the big picture.
Time-Weighted vs. Money-Weighted Return
So, which metric should you focus on? Here’s a quick comparison to help you decide which one to use for what purpose.
| Metric | What It Measures | When to Use It | Effect of Cash Flows |
|---|---|---|---|
| Time-Weighted (TWR) | The performance of the investment strategy itself. | To objectively evaluate your strategy and compare it to benchmarks (e.g., S&P 500). | Ignored. It removes the impact of the timing and size of deposits/withdrawals. |
| Money-Weighted (MWR) | Your personal return, heavily influenced by your cash flow decisions. | To understand your actual, personal investment experience and the impact of your timing. | Included. It directly reflects how your cash flow decisions helped or hurt your returns. |
Ultimately, there’s no single “best” metric. They just answer different, equally important questions. Using both gives you the most complete view of your performance as a trader.
- Use TWR to judge your strategy like a pro. This is your pure measure of skill.
- Use MWR to understand your real-world results and see how your timing decisions paid off (or didn’t).
Of course, calculating these manually can be a massive pain, which is where a good trading journal becomes indispensable. If you’re ready to see these metrics in action without the spreadsheet headaches, you can track your stock portfolio for free with tools that automate these calculations, giving you more time to focus on finding your next great trade.
Common Mistakes to Avoid When Calculating Returns
Even the sharpest traders can fall into simple traps that warp their performance results. Calculating a percentage return feels straightforward on the surface, but tiny oversights can paint a dangerously misleading picture of your actual profitability.
Learning the formulas is one thing; avoiding these common mistakes is the other half of the battle. We all know the gut-punch of a losing trade. What’s worse? Thinking you’re winning while hidden costs are quietly bleeding your account dry.
Forgetting About Trading Fees and Commissions
This is, hands down, the most common error I see. It’s so easy to just look at your entry and exit price and call it a day. But every single trade has costs — commissions, exchange fees, and other little charges that come directly out of your pocket.
Your cost basis isn’t just the share price; it’s the total amount of cash that left your account to get into the position. Likewise, your proceeds aren’t the sale price; it’s what lands in your account after your broker takes their cut.
- How to Fix It: Always subtract all fees from your final sale proceeds and add them to your initial purchase price. This gives you the true start and end values for an honest calculation. A good trading journal handles this automatically, but if you’re rocking a spreadsheet, you have to build this logic into your formulas.
Miscalculating Your Cost Basis After Corporate Actions
What happens when a company you own announces a stock split? Let’s say you have 100 shares of a stock at $200, and it does a 2-for-1 split. You now own 200 shares, but they’re priced at $100 each. The total value is the same ($20,000), but your cost basis per share just got cut in half.
If you don’t adjust your cost basis after splits, mergers, or spinoffs, your return calculations will be completely useless. Selling those 200 shares later at $110 might look like a huge loss against your original $200 purchase price, but in reality, you’ve actually booked a 10% gain.
Your cost basis is not a static number. It’s a living figure you have to update anytime a corporate action changes the structure of your holdings. Staying on top of this is non-negotiable for accurate tracking.
Comparing Returns Over Different Timeframes
Another critical blunder is comparing raw percentage gains without factoring in the holding period. A 15% return you lock in over six months is worlds better than a 15% return that took two years to achieve. Without annualizing your returns, you’re comparing apples to oranges and can’t make a fair judgment about your strategies.
This is a subtle psychological trap. We see a double-digit gain and celebrate, but the time it took to get there is a huge part of the performance story.
-
Consider this practical example:
- Trade A: A 12% return over 9 months.
- Trade B: An 11% return over 4 months.
At first glance, Trade A seems superior. But when you annualize them, Trade A comes out to a 16.2% annualized return. Trade B, however, has a stellar 37.2% annualized return. The context shows which strategy was far more efficient with your capital.
Cherry-Picking Wins and Ignoring Losses
Finally, we have to talk about a psychological bias that affects us all. It feels great to fixate on the big wins — that one trade that shot up 50%. We study it, pat ourselves on the back, and tell ourselves to find more just like it. Meanwhile, we quietly sweep the handful of smaller losses from that same month under the rug.
Your actual portfolio performance is the net result of all your trades, the good and the bad. Ignoring how losses drag down your total return gives you a false sense of confidence and stops you from fixing the real weak spots in your strategy. Honest self-assessment means looking at the whole picture, not just the highlight reel.
Using a Trading Journal to Automate Your Calculations
Knowing the formulas for simple, annualized, and portfolio returns is a massive step forward. But let’s be real — the idea of manually calculating a Time-Weighted Return every time you deposit funds, or logging every single fee in a spreadsheet, can feel like a full-time job. It’s often the biggest thing that stops traders from tracking their performance properly.
We’ve all been there. You start a spreadsheet with the best intentions, but life gets busy, and it gets neglected. Before you know it, you have a huge backlog of trades to enter, and the whole thing feels so overwhelming you just give up. This is a super common problem, and it’s exactly where technology steps in to offer a practical, powerful fix.
A modern trading journal is built to get rid of this friction. Instead of you spending hours on data entry and fighting with formulas, it does all the heavy lifting for you. This turns performance tracking from a chore into a seamless part of your trading routine.
From Manual Data Entry to Intelligent Insights
The real power of a dedicated trading journal isn’t just about saving time; it’s about the accuracy and depth of the insights you get automatically. The tool becomes your personal performance analyst, quietly working in the background to give you a clear, honest picture of your trading.
Just think about these scenarios, all handled without you lifting a finger:
- Effortless Logging: Every trade is pulled in directly from your broker, capturing the exact execution price, commissions, and fees. This kills the risk of manual typos and guarantees your cost basis is always perfect.
- Automatic TWR Calculation: Let’s say you deposit $5,000 into your account. A journal instantly sees this cash flow and automatically recalculates your portfolio’s Time-Weighted Return, so you can keep benchmarking your strategy’s performance without missing a beat.
- Real-Time Analytics: Your dashboard updates instantly after every single trade, showing you vital metrics like your win rate, profit factor, and a live equity curve. You see the immediate impact of every decision you make.
A trading journal shifts your focus from being a bookkeeper of past trades to a strategist for future ones. When the “what” is calculated for you, you can spend your energy on the “why” — digging into what’s working, what isn’t, and how to get better.
This kind of automation builds the discipline and long-term mindset that are the hallmarks of successful trading. When calculating percentage return is this easy and accurate, there are no more excuses for flying blind.
Making Data-Driven Decisions a Reality
The ultimate goal of tracking your returns is to make smarter decisions. A quality journal visualizes your data in a way that makes patterns and tendencies impossible to ignore. You can filter your trades by strategy, ticker, or even time of day to see exactly where your strengths and weaknesses are.
For traders looking to streamline this process, TradeReview offers a comprehensive solution. It automates everything from trade logging to advanced performance analytics, giving you a crystal-clear view of your returns. You can even auto-import trades from your broker, removing manual entry from your workflow for good.
Ultimately, using a journal is about creating a feedback loop. You trade, the journal logs and analyzes, and you review the data to refine your approach. This cycle of execution, reflection, and adjustment is how real, consistent improvement happens.
Common Questions and Curveballs
Even when you have the formulas down cold, real-world trading throws a few curveballs. I get it — the small details matter, and getting them right is the only way to get an honest look at your performance. Let’s tackle some of the questions that pop up most often.
How Do Dividends Affect My Percentage Return?
Dividends are a huge part of your total return, and you absolutely can’t ignore them. Think of a dividend as a cash bonus paid directly to you just for holding the stock.
To factor them in, you simply add any dividends you received to your final sale price before you run the numbers.
Let’s say you bought a stock for $100 and sold it for $110. While you held it, the company paid out a $2 dividend. Your total return isn’t just the $10 you made from the price jump.
The real math looks like this: ((Ending Price + Dividend) - Beginning Price) / Beginning Price.
So, for our example: (($110 + $2) - $100) / $100 = 0.12. That’s a 12% total return. If you had ignored that dividend, you’d be short-changing your own performance.
What Is a Good Percentage Return on My Portfolio?
This is the classic question, but there’s no magic number. A “good” return depends entirely on your strategy, how much risk you’re comfortable with, and what the market is even doing.
A conservative, long-term investor might be ecstatic with a steady 8% a year. An aggressive day trader, on the other hand, is shooting for something much higher.
The most effective way to judge your performance is to measure it against a benchmark.
For most people trading US stocks, the S&P 500 is the go-to yardstick. If the S&P 500 returned 15% last year and your portfolio was up 18%, you can confidently say you had a great year. Why? Because you beat the market. Consistently outperforming your benchmark is one of the clearest signs that your strategy is working.
Can I Calculate These Returns in a Spreadsheet?
Sure you can. For basic calculations, tools like Excel or Google Sheets work just fine. A simple formula like =(End_Value - Start_Value) / Start_Value is all you need to analyze a single, straightforward trade.
But — and this is a big but — it gets messy fast.
Once you start adding money to your account or taking it out, accurately calculating your true portfolio return becomes a nightmare. Trying to manually implement Time-Weighted or Money-Weighted Return formulas in a spreadsheet is not only incredibly tedious but also dangerously prone to error.
This is exactly where a dedicated trading journal comes in. It handles all those complex calculations for you, automatically and accurately.
Stop drowning in spreadsheets and start making data-driven decisions. TradeReview automatically syncs your trades, calculates your true performance metrics, and gives you the insights needed to trade smarter. Get your free trading journal today.


