
If you’ve ever felt like you’re guessing when it comes to options trading, you’re not alone. It’s a common struggle. The secret to moving from guesswork to a calculated strategy lies in understanding the “Greeks.” In short, they’re a set of risk metrics that tell you exactly how sensitive your option’s price is to key market factors.
Think of the Greeks as your personal dashboard for navigating the options market. They reveal how much risk you’re taking on from shifts in the underlying stock price, the relentless tick of time, and swings in market volatility. Without them, you’re flying blind.
Your Cockpit View of Every Trade
Imagine a pilot trying to fly a 747 without an instrument panel — no speedometer, no altimeter, no fuel gauge. It would be pure chaos. Trading options without knowing the Greeks is the same kind of gamble. It’s a recipe for frustration and costly mistakes, leaving you hoping for the best but lacking the critical data needed for smart, repeatable decisions.
The Greeks are the instruments in your trading cockpit. They aren’t just abstract theories for academics; they are practical, real-time tools that every options trader needs to master to build a long-term, disciplined approach.
The Trader’s Instrument Panel
Just like a car’s dashboard gives you instant feedback on your speed and fuel, each Greek tells you something specific and vital about your trade’s behavior. Getting a handle on them is what separates speculators from strategists.
- Delta (Your Speedometer): This shows how much your option’s price will move for every $1 change in the underlying stock. It’s a direct measure of your directional risk.
- Gamma (Your Accelerator): This tells you how fast your Delta will change as the stock moves. It’s a measure of your position’s acceleration — or instability.
- Theta (Your Fuel Gauge): This is the silent cost of holding a long option — time decay. Theta shows how much value your option loses every single day, just from the passage of time.
- Vega (The Road Conditions): This gauges how sensitive your option is to changes in implied volatility — the market’s “fear gauge.” When volatility spikes or drops, Vega tells you how your option will react.
This simple map shows how these core market forces — price, time, and volatility — are directly connected to the main Greeks you’ll be watching.
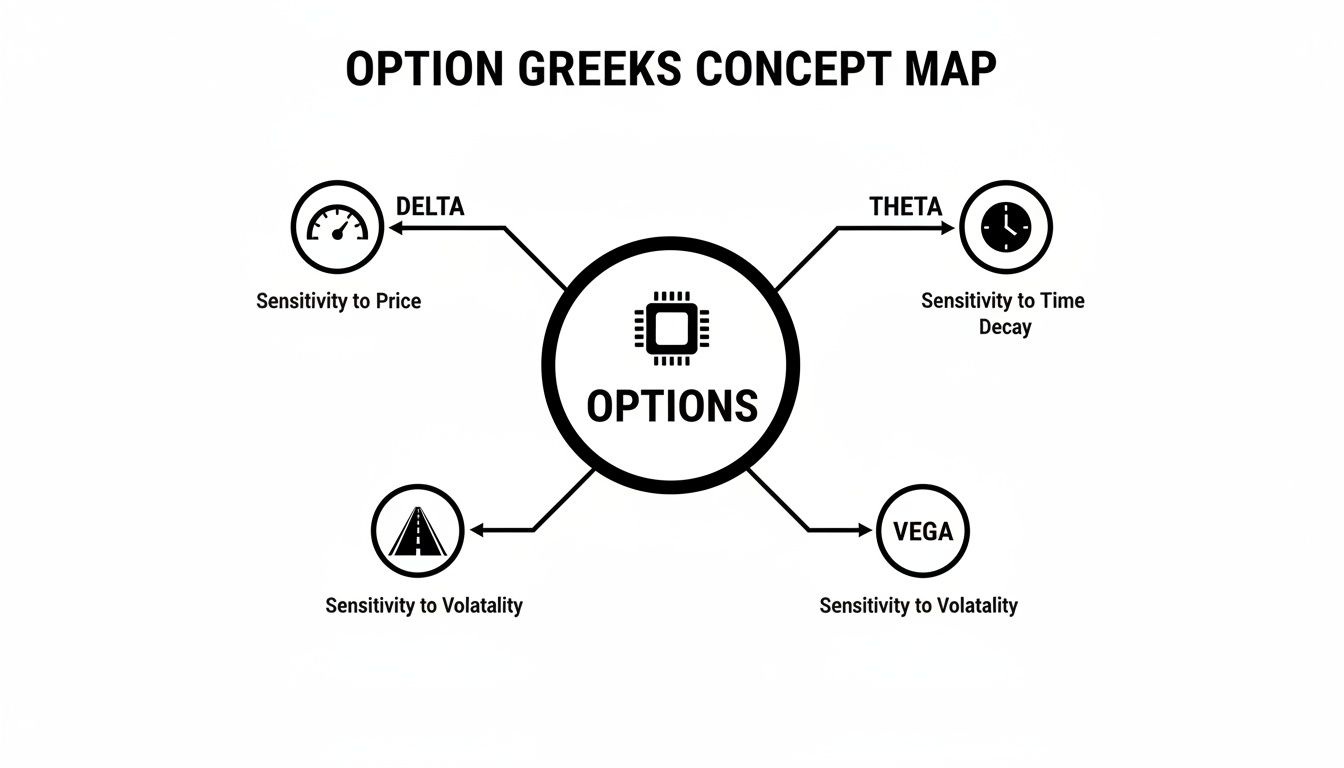
Each Greek gives you a different lens to view your trade, helping you manage your risk and spot opportunities you would have otherwise missed.
Understanding the Greeks transforms you from a passenger to a pilot. You stop merely reacting to market movements and start proactively managing the forces that influence your position’s value. This shift is fundamental to developing a sustainable, long-term trading process.
To give you a quick reference, here’s a simple breakdown of the four major Greeks.
The Four Major Option Greeks at a Glance
| Greek | What It Measures | Primary Influencing Factor | Simple Analogy |
|---|---|---|---|
| Delta | Rate of change in option price relative to the stock price. | Stock Price Movement | Speedometer |
| Gamma | Rate of change in Delta. | Stock Price Movement | Accelerator |
| Theta | Rate of price decay over time. | Time to Expiration | Fuel Gauge |
| Vega | Rate of change in option price relative to volatility. | Implied Volatility | Road Conditions |
This table is a great starting point, but true mastery comes from seeing these forces in action.
By learning to read this “dashboard,” you can anticipate how your positions will behave in different scenarios. This knowledge is the bedrock for building smarter, more resilient options trading strategies and moving beyond just making simple directional bets.
The rest of this guide will break down each Greek one-by-one, giving you the practical insights you need to navigate the markets with more confidence and control.
Delta: Understanding Your Directional Exposure

Of all the option Greeks, Delta is the one you’ll run into first and most often. Think of it as your position’s speedometer — it tells you how much your option’s price should move for every $1 change in the underlying stock. Getting a handle on this metric is the first real step toward managing your directional risk like a pro.
So many traders, especially early on, get blindsided when a position moves way more aggressively than they anticipated. It’s a frustrating experience. The reason? They weren’t watching their Delta. Mastering this Greek is how you graduate from pure speculation to making calculated decisions about how much market exposure you’re truly comfortable with.
How Delta Works in Practice
Delta is shown as a number between 0 and 1.0 for call options and -1.0 and 0 for put options. This isn’t just some abstract value; it’s a practical, real-world guide to how your option will behave.
Let’s walk through a practical example. Imagine you buy a call option on stock XYZ with a Delta of 0.50. This tells you:
- If XYZ stock climbs by $1, your option’s premium will increase by roughly $0.50. Since one option contract represents 100 shares, this translates to a $50 gain on your position.
- On the flip side, if XYZ stock drops by $1, your option’s premium will fall by about $0.50, resulting in a $50 loss.
For puts, it’s just the inverse. A put with a Delta of -0.40 would gain about $0.40 in value for every $1 the underlying stock falls. It would lose $0.40 for every $1 the stock rises. That negative sign simply signals the bearish nature of a put option.
The true power of Delta really shows up during wild market swings. For instance, during the market crash of October 1987, at-the-money call options on the SPX index saw their deltas shoot from around 0.50 to nearly 1.0 almost overnight. This dramatically amplified losses for traders compared to just holding the stock. You can find more historical option pricing data over at sites like Optionistics.
Delta as a Proxy for Probability
Beyond just price sensitivity, Delta has another incredibly useful trick up its sleeve. It works as a rough estimate of the probability that an option will expire in-the-money (ITM).
A call option with a Delta of 0.30 can be interpreted as having an approximate 30% chance of finishing ITM at expiration. This probabilistic view helps you frame your trades not just in terms of potential profit, but also in terms of likelihood.
This link isn’t perfect, but it’s a powerful mental shortcut that seasoned traders use constantly to quickly size up the risk-reward of a trade.
Key Characteristics of Delta
Knowing how Delta behaves under different conditions is absolutely critical for avoiding nasty surprises.
- At-the-Money (ATM) Options: When an option’s strike price is right near the current stock price, it will typically have a Delta around 0.50 (for calls) or -0.50 (for puts). Think of it as having a 50/50 shot of expiring ITM.
- In-the-Money (ITM) Options: As an option moves deeper into the money, its Delta gets closer to 1.0 (for calls) or -1.0 (for puts). A deep ITM option starts to behave almost exactly like owning 100 shares of the stock.
- Out-of-the-Money (OTM) Options: The further an option moves out of the money, the closer its Delta gets to 0. These “lottery ticket” options are far less sensitive to small moves in the stock.
By keeping an eye on Delta, you can intentionally choose your level of directional exposure. Whether you want an aggressive, high-delta position or a more conservative, low-delta one, this Greek puts you in control. It lets you align your trades with your market outlook and risk tolerance — the very foundation of a disciplined trading plan.
Gamma: Measuring the Acceleration of Your Position

If Delta is your position’s speedometer, then Gamma is the accelerator pedal. It measures how quickly your Delta changes for every $1 move in the underlying stock. This is the Greek that makes options so dynamic — and, if you don’t respect it, so incredibly dangerous.
Ever had a small stock move send your P&L swinging wildly out of control? That unsettling feeling is often Gamma at work. It dictates how quickly your directional exposure ramps up or down, and ignoring it is a classic mistake that can lead to significant, unexpected losses.
The Real-World Impact of Gamma
Gamma tells you how much your Delta is going to change. Let’s say you buy a call option with a Delta of 0.40 and a Gamma of 0.05. Here’s how it plays out:
- If the stock price rises by $1, your new Delta becomes roughly 0.45 (0.40 + 0.05). Your position is now more sensitive to the next dollar move up.
- If the stock price falls by $1, your new Delta shrinks to about 0.35 (0.40 – 0.05). Your exposure to the stock’s direction has now decreased.
For anyone buying options (long calls or puts), Gamma is always positive. This is part of what you’re paying for! As the stock moves toward your strike, your Delta moves in your favor — getting longer as a call goes in-the-money, or more negative as a put does. This acceleration is one of the biggest draws of trading options.
Why Gamma Is a Double-Edged Sword
While this acceleration is great for option buyers, it’s a massive risk for sellers, who have negative Gamma. High Gamma means high instability.
Gamma is highest for at-the-money (ATM) options that are very close to expiration. This is the danger zone where a position’s risk profile can change in the blink of an eye, turning a manageable trade into a catastrophic loss.
This instability is the fuel for a “gamma squeeze,” where rapid hedging from market makers can cause explosive, self-reinforcing price moves. Being on the wrong side of that is a painful lesson in risk management. A small market move can cause your losses to spiral out of control far faster than you ever anticipated.
We saw this play out in extreme market events. During the 2010 Flash Crash, for example, Gamma on SPY options surged, causing Deltas to explode. This forced algorithmic desks to unwind huge positions, amplifying volatility. You can dig into how these events unfold by looking at historical options data, which sites like HistoricalOptionData.com provide.
Using Gamma for Risk Management
Understanding Gamma isn’t just about avoiding disaster; it’s about making smarter, more disciplined decisions.
- For Option Buyers: High Gamma can be your best friend, but it always comes with higher Theta (time decay). You need the stock to move, and move now, to outrun the clock on those near-term, at-the-money options.
- For Option Sellers: Negative Gamma is your number one risk. A big, unexpected move against your short strike can cause your negative Delta to balloon, exposing you to potentially unlimited losses. Smart sellers often close or adjust positions as they get tested to avoid this scenario.
More advanced traders sometimes use strategies like gamma scalping, where they constantly trade the underlying stock to neutralize Delta and profit from the Gamma itself. But for most of us, the key takeaway is simple: respect Gamma. Knowing how quickly your risk can change is fundamental to surviving and thriving in the options market over the long term.
Theta: Accounting for the Unstoppable Cost of Time

There’s a silent, unstoppable force working against every option buyer — a cost you pay for every single day you hold your position. That force is Theta, and it measures the daily decay in an option’s value from the simple passage of time.
It’s one of the biggest frustrations for new traders. You buy a call option, the stock doesn’t move against you, yet you log in the next day to find your position is worth less. This isn’t some glitch; it’s Theta, the relentless cost of time.
Think of an option’s extrinsic value as a melting ice cube. The moment you buy it, it starts to shrink. Theta tells you exactly how much of that ice cube will melt away by tomorrow. We call this unavoidable erosion time decay.
Why Time Is Your Enemy or Your Ally
For long options (any option you buy), Theta is always a negative number because time is constantly running out. Every day that passes without a strong move in the underlying stock means your option loses a piece of its value. This makes Theta the biggest enemy of an option buyer.
Flip the coin, and for an option seller, Theta is a powerful ally. When you sell an option, you collect the premium right away. Time decay works in your favor because you want the option’s value to decrease so you can buy it back cheaper or, even better, let it expire worthless. For sellers, Theta represents potential daily income.
This dual nature is a core concept in options trading.
The struggle isn’t just about being right on direction; it’s about being right within a specific timeframe. Theta ensures there are no free passes — every day you hold a long option, the clock is ticking against you.
Grasping this dynamic is absolutely critical. It shifts your thinking from “Will this stock go up?” to “Will this stock go up fast enough to outrun the daily cost of Theta?”
The Acceleration of Time Decay
Theta’s effect isn’t a straight line; it accelerates like a snowball rolling downhill. An option with months until expiration will have a tiny Theta, meaning its value decays slowly. But as the expiration date gets closer, the rate of decay picks up speed — dramatically.
- Long-Dated Options (90+ days): Theta is low. The ice cube is large and melting very slowly.
- Mid-Range Options (30-60 days): Theta starts to increase. The melting process becomes noticeable.
- Near-Term Options (Under 30 days): Theta gets extremely high. The ice cube is now melting rapidly, losing a big chunk of its value each day.
This acceleration is most aggressive for at-the-money options in their final few weeks. The market knows time is running out for the option to make a decisive move, so its time value evaporates at an astonishing rate.
Practical Implications for Traders
A disciplined trader always respects Theta. It means understanding that holding a position is never free. For example, deciding to hold a high-decay option over a weekend means you’re paying for two or three days of Theta decay (Friday, Saturday, and Sunday) all at once.
This isn’t just theory; it has real financial consequences. During periods of low volatility, premium-collecting strategies like short straddles or iron condors can perform well because Theta consistently erodes the value of the options sold. You can learn more about how historical Greek behavior influences strategy performance with data-driven insights from providers like ORATS.
Knowing how Theta works forces you to be more selective. It pushes you to ask the hard questions before you trade: Does this position have enough time to work out? Is the potential reward worth the daily cost of time decay? Answering these questions is key to managing risk and preserving your capital for the long run.
Vega: Gauging the Impact of Fear and Greed
While Theta is the slow, steady erosion of time, Vega is the Greek that tunes into the market’s raw emotion — its fear and its greed. In short, Vega tells you how much an option’s price will move for every 1% change in its implied volatility (IV).
Think of implied volatility as the market’s “fear gauge.” When traders brace for big news, like an upcoming earnings report or a Fed announcement, IV tends to spike. All that uncertainty makes options more expensive, and Vega is what tells you exactly how much your position stands to gain or lose from that shift in sentiment.
It’s a classic, painful lesson for new traders: you nail the direction of a stock, but still somehow lose money on the trade. Understanding Vega is the key to making sure that doesn’t happen to you.
The Painful Reality of Volatility Crush
Anyone who’s ever held options through an earnings report knows the brutal sting of “volatility crush,” or “IV crush.” It’s Vega teaching you a lesson you won’t soon forget.
Here’s how the all-too-common scenario plays out:
- You grab a call option on stock ABC, convinced they’re about to crush their earnings and send the stock flying.
- The report comes out, and you were right! The numbers are great, and the stock pops.
- But when you check your P&L, you’re horrified. You’ve barely broken even, or worse, you’re in the red.
So, what went wrong? Before the announcement, uncertainty was sky-high, which pumped up the option’s implied volatility and its price. The moment the news dropped, all that uncertainty vanished. Implied volatility plummeted, and the option’s premium deflated like a popped balloon — often erasing any gains you made from the stock’s actual move.
Vega is what quantifies the risk of overpaying for an option when market anxiety is peaking. A high Vega means your option’s value is dangerously dependent on that uncertainty sticking around. When it disappears, so does your premium.
How to Interpret Vega in Your Trading
Vega is always shown as a dollar amount. If your option has a Vega of 0.10, its price will climb by $0.10 for every 1% jump in implied volatility. On the flip side, its price will fall by $0.10 for every 1% drop in IV.
A few key things to remember about how Vega behaves:
- Longer-Dated Options Have Higher Vega: An option with six months until it expires is way more sensitive to volatility changes than one expiring next week. More time means more opportunity for a big move.
- At-the-Money Options Have the Highest Vega: Options whose strike prices are closest to the current stock price feel the biggest impact from shifts in volatility.
A smart trader always glances at an option’s Vega before pulling the trigger, especially when a big catalyst is on the horizon. If Vega is unusually high, it’s a huge red flag that you might be paying a massive premium for pure hype. You can learn more about how these forces work in our guide on what is market volatility. This simple check can help you sidestep the trap of buying into peak fear or greed, protecting your capital for smarter, more sustainable trades.
Applying Your Knowledge with a Trading Journal
Learning about the option Greeks is a massive step forward, but theory alone won’t make you a better trader. Real growth happens when you connect the dots between the concepts and how they actually impact your P&L. This is where keeping a disciplined trading journal becomes your secret weapon.
Too many traders just log their profits and losses, which only gives you a tiny piece of the picture. A detailed journal forces you to dig deeper and understand the why behind every single trade. It turns a simple list of trades into a rich dataset you can use to find your edge.
Moving Beyond Simple P&L Tracking
A powerful trading journal lets you track the Greeks for every trade, both when you get in and when you get out. By tagging and organizing your trades, you can start asking much smarter questions about your performance.
This is how you uncover patterns that would otherwise stay hidden:
- Gamma Analysis: Are you constantly getting burned by high-gamma positions that explode right before expiration? A journal will show you if you’re taking on too much risk from rapid Delta shifts.
- Theta Strategies: Do your best trades come from selling premium and letting Theta decay do the heavy lifting? Seeing that data in black and white can give you the confidence to lean into that strategy.
- Vega Management: A journal can reveal if you’re repeatedly losing money to volatility crush after earnings announcements. That kind of feedback is gold — it might push you to avoid high-IV trades or find better strategies for catalyst events.
The whole point is to shift from making reactive, emotional decisions to building a disciplined, data-backed trading process.
This dashboard from a trading journal is a perfect example of how you can see your performance at a glance, tracking vital stats like win rate, profit factor, and your overall P&L.
Seeing your equity curve laid out like this gives you instant feedback on how well your strategies are actually working over time.
Building Your Feedback Loop for Improvement
Think of your trading journal as your personal feedback loop. Every single entry is a data point that helps you tweak your rules, manage risk better, and understand your own psychology as a trader. It’s a discipline that pays off big time over a trading career.
A journal transforms your experiences — both the good and the bad — into structured lessons. It’s the difference between just making trades and deliberately building a skill.
This methodical review process is what separates consistently profitable traders from those stuck on the boom-and-bust rollercoaster. It helps you pinpoint your strengths so you can do more of what works, and it shines a harsh (but necessary) light on your weaknesses so you can fix them.
To get started, you can explore tools and templates built just for this. For a deeper dive, check out our guide on finding a great options trading journal template that works for you. By committing to this process, you’re giving yourself the best shot at growing from every trade and building a sustainable career in the markets.
Lingering Questions About Option Greeks
Even after a deep dive into the Greeks, it’s completely normal to have a few questions rattling around. This stuff is complex, and bridging the gap from theory to actually using it in your trading takes time.
Let’s tackle some of the most common questions traders ask when they first start putting these powerful tools to work. The goal is to clear up any final bits of confusion and give you the confidence to start applying what you’ve learned.
Which Greek is the Most Important?
This is the big one, and the honest answer is: it depends entirely on your strategy.
Thinking one Greek is the “best” is a classic rookie mistake. A disciplined trader knows which Greek matters most for the specific job they’re trying to do.
- Making a simple directional bet? Delta is your North Star.
- Selling premium to generate income? Theta is your best friend.
- Trading around a big catalyst like an earnings report? Vega suddenly takes center stage.
But the real pros know the Greeks don’t work in isolation. They look at all of them together to get a complete 360-degree view of a position’s risk before they ever hit the buy or sell button.
How Do I Find the Greeks for an Option?
Good news: you don’t need fancy software or a math degree.
Virtually every modern trading platform shows the option Greeks right in the option chain — that standard table listing all the available calls and puts. You’ll typically see columns for Delta, Gamma, Theta, and Vega right next to the bid and ask prices.
Before your next trade, poke around your broker’s interface. Finding this info is a fundamental first step.
Ignoring the Greeks is like driving a car without a dashboard. Sure, you might get where you’re going, but you’re blind to the fact that you’re about to run out of gas or blow the engine.
Even on a simple long call, Theta is quietly bleeding your premium every single day. A post-earnings “Vega crush” can vaporize your profits, even if you guessed the direction right. Understanding the Greeks gives you the context you need to see these risks coming and make much smarter, more strategic decisions.
Ready to turn these concepts into a real, data-driven edge? The single best way to see how the Greeks actually impact your bottom line is with a trading journal. TradeReview gives you the analytics you need to stop guessing and start building a repeatable process. Track your trades for free and find your edge today.


