
At its core, the profit and loss equation is simple: Total Revenue – Total Expenses = Net Profit or Loss. While the math is straightforward, truly understanding this concept goes way beyond just the final number. It’s about learning to read the story your trading results are trying to tell you, and then using that story to build discipline for the long term.
Your P&L Is More Than Just a Number
It’s all too easy to fixate on the big wins and conveniently forget the losses. We’ve all been there. The rush of a profitable trade feels incredible, while a loss can sting, making you want to just move on. But long-term success isn’t built on emotional reactions; it’s forged in objective analysis and discipline.
Think of the profit and loss equation as your ultimate scorecard. It’s a direct, unfiltered reflection of how effective your strategy is, the quality of your decisions, and your ability to manage risk. When you start seeing it this way, P&L transforms from a simple outcome into a powerful diagnostic tool.
A Mindset for Growth
Trading like a professional means giving both sides of the equation — profits and losses — equal weight. A profit confirms your strategy worked in that specific instance, which is great. But a loss? That’s a valuable lesson, gift-wrapped. To really grow, you have to be able to analyze what went wrong without letting your ego or emotions cloud your judgment. We understand this is one of the hardest parts of trading, but it’s a hurdle every successful trader must overcome.
This is a fundamental concept in any business, not just trading. For example, corporate profit margins in the United States have seen significant fluctuations over the years. According to historical data, these margins have seen peaks and valleys reflecting broader economic cycles. The companies that survive these cycles are the ones that obsessively analyze every detail of their revenue and expenses to make smart, informed decisions. You can check out some of these corporate profit margin trends on GuruFocus.com.
The goal of a successful trader is to make the best trades. Money is secondary. — Alexander Elder
Once you move past the emotional highs and lows, you can start using your P&L data to genuinely refine your approach. This guide will show you how to dissect this crucial equation, account for every little variable, and use the insights to become a more consistent and disciplined trader. The first step is getting a clear, organized view of your performance, just like you’d see in a well-structured trading journal dashboard.
Calculating Your Gross Profit and Loss
Before you can really start picking apart your trading performance, you have to get a handle on the basic profit and loss equation. At its heart, this is all about figuring out your gross result — the raw outcome of a trade before costs like commissions or fees muddy the waters. Think of it as the essential first step to knowing where you stand financially.
Many traders, especially early on, get tangled up in how the math changes between different asset classes. While the core idea is always the same, the moving parts can look a little different. Let’s break down the gross P&L calculation for stocks, forex, and options with some clear, practical examples.
The Stock Trading P&L Equation
Stocks are probably the most straightforward way to understand the profit and loss equation. The calculation is simply the difference between what you sold your shares for and what you paid for them, multiplied by how many shares you traded.
Here’s the basic formula:
Gross P&L = (Sale Price per Share – Purchase Price per Share) x Number of Shares
Let’s walk through a practical scenario. Say you’ve done your research, you think a company is undervalued, and you decide to jump in.
- Action: You buy 100 shares of Company XYZ at $170 per share.
- Total Purchase Cost: 100 shares x $170 = $17,000
- A week later, your analysis proves correct. The stock price has climbed, and you decide it’s time to take your profit.
- Action: You sell all 100 shares at $175 per share.
- Total Sale Value: 100 shares x $175 = $17,500
Using the formula, your gross profit comes out to: ($175 – $170) x 100 = $500. This $500 is your gross profit before any broker fees are taken out.
The whole point of tracking this is to make better decisions next time. Every trade, win or lose, gives you data.

As this shows, both your profits and your losses feed back into your strategy. They’re just pieces of information to guide your next move.
Calculating P&L for Forex and Options
The profit and loss equation just needs a little tweaking for other markets. Each one has its own quirks, but the logic stays the same.
- Forex Trading: In the foreign exchange market, you’ll hear traders talk about pips. A pip (short for “percentage in point”) is the smallest price change in an exchange rate, and it’s how profit and loss are measured. Your P&L is essentially the monetary value of a pip multiplied by how many pips the currency pair moved in your favor. For instance, a 50-pip gain on a standard lot of EUR/USD could translate to a $500 profit.
- Options Trading: With options, it all comes down to the premium — the price you pay to buy the contract. Your profit is the difference between the premium you receive when you sell the option and the premium you paid to buy it, multiplied by the number of contracts (and remember, one contract usually represents 100 shares).
It’s easy to feel like you’re drowning in numbers at first, but remember that every seasoned trader started by mastering these simple calculations. Getting disciplined about tracking these gross figures is the foundation for smart, long-term thinking and real strategic improvement. In the next sections, we’ll dig into how to refine this number by factoring in all the hidden costs that reveal your true net profit.
Finding Your True Net P&L
That number you see on your screen right after closing a trade? That’s not what you actually get to keep. A trade that looks like a winner at first glance can easily turn into a loser once you account for the real-world costs of playing the game.
This is where we separate the amateurs from the pros — by moving past the simple gross profit and digging into your true net P&L.
The formula itself is straightforward, but its impact is massive.
Net P&L = Gross P&L – Total Trading Costs
It’s a tiny adjustment, but it’s everything. These costs aren’t optional; they are a fundamental part of every single trade you make. Ignoring them is like trying to plan a road trip without looking at the cost of gas and tolls — you’re missing critical pieces of the puzzle and might not make it to your destination.

The Hidden Costs That Eat Into Profits
To get a real, honest look at your trading performance, you have to track every single expense. There are three main culprits that will chip away at your gains: commissions, fees, and the ever-frustrating slippage.
- Commissions: This is what your broker charges you for executing your buy and sell orders. It might be a flat rate per trade or a small percentage of the total value.
- Fees: This is a catch-all for other small charges. Think exchange fees, regulatory fees, or data access fees. They seem tiny on their own, but they compound in a big way over hundreds of trades.
- Slippage: This one really stings. It’s the difference between the price you expected to get and the price you actually got. In fast-moving markets, it’s almost a given, and it almost always works against you. You end up buying a little higher or selling a little lower than you planned.
Let’s go back to our earlier example: buying 100 shares of Company XYZ at $170 and selling at $175 for a $500 gross profit. Now, let’s inject a dose of reality.
Let’s say your broker charges a $5 commission each way (one to buy, one to sell). On top of that, you got hit with $0.02 per share in slippage on both your entry and your exit.
Here’s how the math breaks down:
- Total Commissions: $5 (to buy) + $5 (to sell) = $10
- Slippage Per Share: $0.02 (entry) + $0.02 (exit) = $0.04
- Total Slippage Cost: $0.04 x 100 shares = $4
- Total Trading Costs: $10 (commissions) + $4 (slippage) = $14
Now, we plug that back into our profit and loss equation:
Net P&L: $500 (Gross Profit) – $14 (Total Costs) = $486
In this scenario, the costs were just a small dent. But imagine you’re a scalper or a high-frequency trader aiming for much smaller gains. A few dollars in costs can be the difference between a winning and a losing trade.
Impact of Trading Costs on Net Profit
To see just how dramatically these costs can alter your results, let’s compare two scenarios for the same trade. This table illustrates how a seemingly profitable position can quickly turn sour once fees and slippage are factored in.
| Metric | Scenario A (No Costs) | Scenario B (With Fees & Slippage) |
|---|---|---|
| Buy Price | $170.00 | $170.02 (Slippage) |
| Sell Price | $175.00 | $174.98 (Slippage) |
| Gross Profit / Share | $5.00 | $4.96 |
| Total Gross Profit (100 Shares) | $500.00 | $496.00 |
| Commissions | $0.00 | $10.00 |
| Total Costs | $0.00 | $14.00 |
| Net P&L | $500.00 | $486.00 |
As you can see, the $500 “paper profit” in Scenario A is a fantasy. The reality for most traders is closer to Scenario B, where commissions and slippage immediately reduce the gain.
This professional mindset — accounting for costs before you even click the “buy” button — is what keeps you in the game long-term. It forces you to be more selective with your trades and helps you maintain realistic expectations.
Realized vs. Unrealized P&L
There’s a massive difference between ‘paper profits’ and cold, hard cash in your account — a lesson most traders learn the hard way. This is the world of unrealized versus realized P&L, and getting a handle on the psychology behind it is non-negotiable for long-term survival.
Think of it like this: an unrealized profit is just the estimated value of your house. It looks great online, but you can’t spend that money until you sell. In trading, an unrealized P&L is the floating profit or loss on a position you still hold. It’s a phantom number, dancing up and down with every market tick.
A realized P&L, on the other hand, is the profit or loss you lock in the moment you close the trade. That’s the money that actually hits your balance. It’s final.
The Psychology of Paper Profits
The emotional gravity of an unrealized P&L is powerful. When a trade is deep in the green, greed starts whispering in your ear: “Just a little longer… it could go even higher!” But when that same trade turns red, hope becomes your worst enemy. You cling to a losing position, praying for a miracle as the unrealized loss digs a deeper hole.
This is a classic emotional trap, and we’ve all been there. Success in the markets comes from discipline and strategy, not from wishful thinking. In fact, if you look at the big picture, multinational corporate profits have grown far faster than global profits over the decades — a trend driven by deliberate, strategic execution. You can discover more about these global profit trends to see how strategy, not hope, drives large-scale financial results.
An unrealized profit is just an opinion. A realized profit is a fact. Discipline is what turns the former into the latter.
Let’s walk through a painful — and all too common — scenario. Say you buy a stock at $50, and it rips to $70. You’re sitting on a $20 per share unrealized gain, and you feel like a genius. You hold on, dreaming of $80.
Then the market turns. The stock drops to $60, then back to $50, and then craters to $45. Panic finally sets in, and you sell. Your beautiful paper profit just morphed into a nasty $5 per share realized loss.
This happens every single day, and it’s almost entirely preventable. The antidote is simple but not easy: have a rock-solid exit plan before you ever enter a trade. Know exactly where you’ll take profits and where you’ll cut your losses, then find the iron discipline to stick to that plan, no matter what your emotions scream at you.
How Leverage Amplifies Your P&L
Leverage is one of the most powerful — and dangerous — tools in a trader’s arsenal. Think of it as a financial magnifying glass; it makes everything bigger. When the market moves in your favor, leverage can dramatically boost your profits. But when it moves against you, it can inflict devastating losses just as quickly.
This amplification effect is why a deep understanding of leverage is non-negotiable for anyone serious about trading. It directly and dramatically impacts your profit and loss equation, turning what would be minor market fluctuations into major events for your account balance. Ignoring its double-edged nature is one of the fastest ways to blow up a trading account.

A Practical Example of Leverage in Action
Let’s see how this works with a real-world example in forex trading. Imagine you have a $1,000 account and you’re looking to trade the EUR/USD currency pair.
- Without Leverage: With your $1,000, you could control $1,000 worth of currency. If EUR/USD moves up by 1%, your position value increases by $10 (1% of $1,000). A respectable 1% return on your capital.
- With 50:1 Leverage: Now, let’s say your broker offers you 50:1 leverage. Your $1,000 can now control a position size of $50,000. If EUR/USD moves up by that same 1%, your position value increases by $500 (1% of $50,000). That’s a staggering 50% return on your initial $1,000 capital from just a tiny market move.
This is the seductive power of leverage. It creates the potential for outsized returns from a small amount of capital, but it doesn’t come without significant risk.
The Amplification of Losses
Now, let’s look at the dark side of that same trade. What happens if the market moves against you by 1% instead?
With 50:1 leverage, a 1% move against your position results in a 50% loss of your trading capital. A mere 2% adverse move would wipe out your entire account.
This isn’t meant to scare you, but to instill a deep and healthy respect for risk. Over-leveraging is a classic mistake for new traders, usually driven by greed and impatience. It transforms trading from a game of strategy and probability into a reckless gamble.
The key to long-term survival is to use leverage judiciously, if at all. Always calculate your potential loss before you enter a trade and make sure it’s a number you can emotionally and financially handle. Preserving your capital is your number one job as a trader; chasing huge profits with excessive leverage will only ensure you don’t stay in the game long enough to succeed.
Using Your P&L to Improve Your Trading
Your P&L data is so much more than a simple scoreboard of wins and losses; it’s a detailed roadmap showing you exactly where you can improve. Too many traders glance at their results, feel good or bad about the outcome, and just move on to the next trade. But if you want to build long-term consistency, you have to turn that raw data into actionable insights — and that all starts with a disciplined journaling habit.
Tracking your trades is how you uncover the hidden patterns in your performance. When you start logging the context behind each position, you transform the profit and loss equation from a simple calculation into a personal diagnostic tool. This forces you to get past the emotional highs and lows and start asking objective, hard-hitting questions about your process.
From Data to Decisions
A well-kept trading journal helps you zero in on your unique strengths and weaknesses. It’s really the only way to get definitive answers to the performance questions that truly matter.
- Are you more profitable during the morning session or the afternoon?
- Do certain chart patterns or setups consistently drain your account?
- How much does your performance dip when you stray from your trading plan?
By meticulously logging your strategy, the market conditions, and even your emotional state, you create a powerful feedback loop. You start to see what works and — more importantly — what doesn’t.
Your trading journal is the ultimate source of truth. It’s the unbiased mirror reflecting the actual decisions you made, not the ones you wish you had.
This granular level of analysis is what separates amateurs from pros. Think about it on a global scale: multinational corporations have reshaped profit distribution by shifting a significant portion of their profits to optimize outcomes based on data. While your trading account is on a different scale, your goal is the same: make informed, data-driven decisions that improve your financial results. You can learn more about these global profit-shifting trends to see just how powerful this kind of strategy can be.
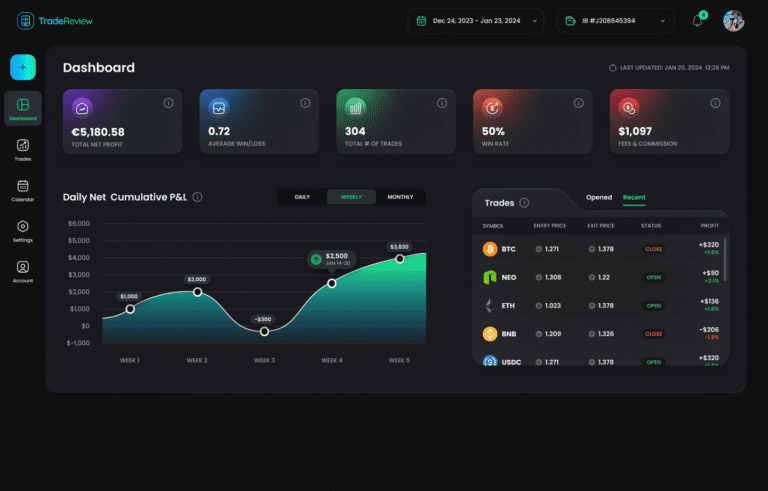
The screenshot below from TradeReview’s features shows how a digital journal can visualize these analytics for you, turning your trade history into clear, actionable insights.
This kind of visual data makes it incredibly easy to spot trends in your P&L, win rate, and average return over time. To make this process even smoother, find a journaling tool that connects directly with your broker. Check out this list of supported brokerages that can auto-sync your trades, which saves you time and ensures your data is always 100% accurate.
Ultimately, the goal is to spend less time on manual data entry and more time analyzing what actually drives your performance.
Common Questions About Trading P&L
Even after you nail down the mechanics, a few lingering questions about the profit and loss equation often pop up. Getting these details right is crucial, because sloppy tracking leads to flawed analysis. Let’s clear up some of the most common points of confusion you might run into.
How Do I Calculate P&L for a Short Position?
This one trips people up, but it’s simple once you remember you’re just flipping the script. Calculating P&L on a short sale is the reverse of a normal “long” trade because you’re betting on the price to fall. You sell high first, then buy low to close it out.
The formula is just inverted: (Entry Price – Exit Price) x Number of Shares.
Let’s say you decide to short 100 shares of a stock at $50. A week later, you’re right — the price drops. You “cover” your position by buying back those same 100 shares at $45. Your gross profit is a straightforward ($50 – $45) x 100 = $500, before you account for any commissions or fees.
Is It Better to Track My P&L in Dollars or Percentages?
Honestly, you need both. They each tell a different, equally important part of your performance story.
Dollar amounts show the real-world impact on your account balance, which is what matters for managing your capital. Percentages, on the other hand, are the great equalizer — they’re essential for comparing performance across different trades and strategies.
Think about it: a 10% gain on a small, well-managed trade might signal far better strategy execution than a 1% gain on a huge, risky position. Using both gives you a true sense of your risk-adjusted returns.
What Is the Best Software for Tracking My Profit and Loss?
This really comes down to where you are in your trading journey. When you’re just starting out, a simple spreadsheet is a fantastic way to learn the fundamentals of tracking from the ground up.
But as you get more serious, dedicated journaling software becomes a game-changer. These platforms automatically pull in your trades and serve up deep analytics, visualizing your performance with metrics you wouldn’t calculate on your own. That’s where you find the powerful insights that actually help you improve.
Ready to move beyond spreadsheets and unlock the real story behind your trading data? TradeReview gives you a powerful, automated trading journal to analyze your performance, spot your patterns, and make smarter decisions. Sign up for free and start improving your strategy today.


