Before you can refine your trading strategy, you have to know if it’s working in the first place. That journey starts with one fundamental metric: your win rate.
Calculating it is refreshingly simple. Just take your number of winning trades and divide it by your total number of trades. Then, multiply that number by 100 to get your percentage. This isn’t just a number; it’s the first step from trading on gut feelings to making decisions backed by cold, hard data.
The Win Rate Formula at a Glance
To put it all in one place, here’s a quick breakdown of what you need to calculate your win rate manually.
| Component | Description | Example |
|---|---|---|
| Winning Trades | The total count of trades that closed with a profit. | 55 profitable trades |
| Total Trades | The complete number of trades you’ve taken (wins, losses, and break-evens). | 100 trades in total |
| The Formula | (Winning Trades / Total Trades) * 100 |
(55 / 100) * 100 = 55% |
This simple formula gives you an immediate, objective snapshot of your performance, cutting through the emotional highs and lows.
The First Step to Smarter Trading
Feeling lost in a sea of trading data? It’s a common struggle. So many traders get fixated on a single spectacular win, but sustainable success is built on understanding your overall performance. Your win rate is the bedrock of that understanding.

It’s just one number, but it reveals how often your strategy is actually hitting the mark. Knowing how to calculate your win rate is fundamental to disciplined, long-term trading because it replaces emotional reactions with objective facts.
From Guesswork to Insight
Without this key metric, you’re essentially flying blind. It’s human nature to remember the big wins vividly while the small, nagging losses that quietly drain an account fade into the background. This emotional bias is one of the biggest roadblocks for developing traders.
Your win rate forces you to take an honest look in the mirror. It helps answer the critical questions that gut feelings simply can’t:
- Is my current strategy actually working consistently?
- Am I really improving, or did I just get lucky this month?
- Where are the real strengths and weaknesses in my approach?
A trader without a clear understanding of their win rate is like a pilot without a compass. You might be moving, but you have no reliable way to know if you’re heading in the right direction.
Ultimately, tracking this number isn’t just about math; it’s about building the discipline that separates successful traders from the rest. It gets you into the habit of logging every trade—the good, the bad, and the break-even—to create a dataset you can actually rely on. This data becomes the foundation for making smarter decisions and moving from emotional guesswork to informed action.
Breaking Down the Win Rate Formula
Figuring out your win rate is surprisingly simple. You don’t need a complicated spreadsheet or a degree in mathematics to get started. At its heart, it’s a straightforward calculation that gives you an immediate pulse on your performance.
The formula looks like this: (Total Winning Trades / Total Number of Trades) x 100 = Win Rate %
That’s it. You only need two numbers: how many trades you won and the total number of trades you took (wins plus losses). Let’s put this into a real-world scenario to see how it works.
A Practical Example
Let’s say last month you placed 50 trades. We all know how tough it can be to review every single trade, especially after a losing streak, but discipline is key. So, you sit down and go through your journal, finding that 30 of them were profitable, while the other 20 ended up as losses.
Now, let’s plug those numbers into the formula:
- (30 Winning Trades / 50 Total Trades) = 0.6
- 0.6 x 100 = 60% Win Rate
Just like that, you know your strategy was successful on 6 out of every 10 trades during that period. This simple metric is a powerful starting point, moving you from gut feelings about your performance to hard, objective facts.
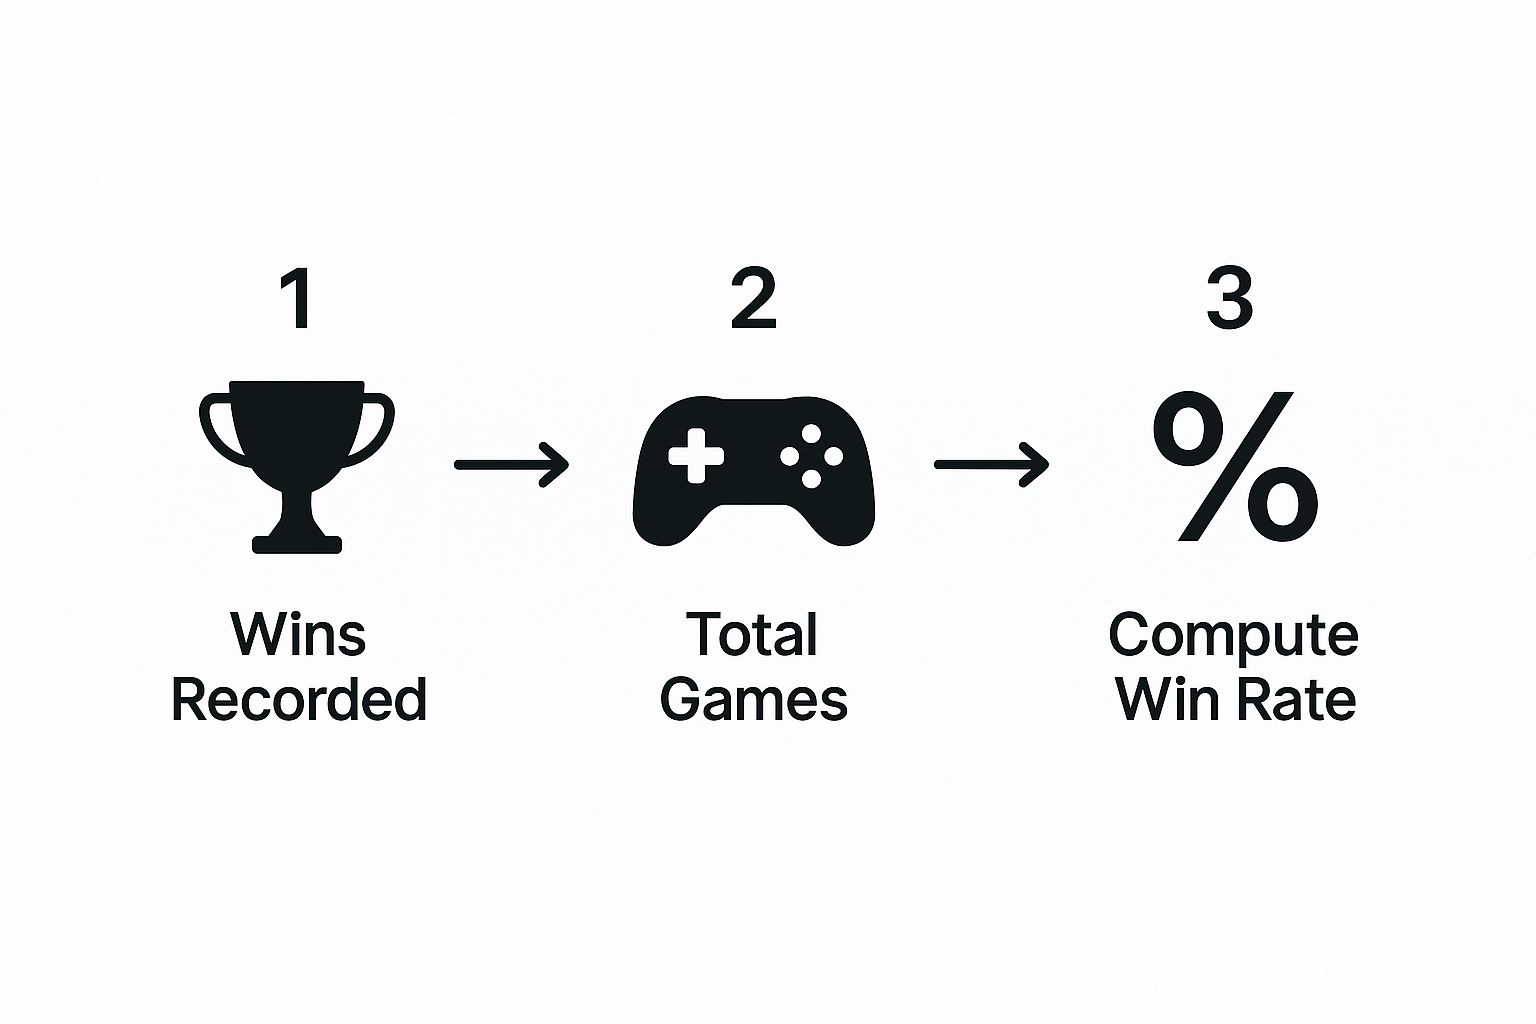
This process—gathering your wins, counting your total trades, and calculating the final percentage—is a logical flow, not some intimidating equation.

This visual really breaks it down. It’s a clear, step-by-step process that anyone can follow.
To get an accurate win rate, you absolutely need clean, honest data. That means logging every single trade with discipline—not just the ones that make you feel good. This is the only way to get a true picture of your performance.
Of course, a high win rate alone doesn’t guarantee profitability. It’s just one piece of the puzzle. But it’s an essential metric for understanding if your approach is working. By consistently tracking it, you can see how changes to your strategy impact your success over time.
This data is the foundation for a deeper dive. Once you have a reliable win rate, you can start exploring other metrics and combining them with different market analysis techniques to truly refine your edge.
Why a High Win Rate Is Not Enough
It’s one of the most common traps new traders fall into: chasing a high win rate. While seeing a screen full of green trades feels great, it’s a dangerously incomplete picture of your actual trading performance. The hard truth is that a 90% win rate can still blow up your account if your few losses are big enough.
This happens because your win rate is only half of the profitability puzzle. The other, equally critical piece is your risk-to-reward ratio. This simply measures how much you make on your winning trades compared to how much you lose on your losing ones. Without that context, a sky-high win rate is just a vanity metric.

A Tale of Two Traders
Let’s look at a practical scenario with two different traders to see why this balance is so vital.
Trader A: The High Win Rate Illusion
This trader is on fire, winning an incredible 90% of their trades. Out of ten trades, nine are small, quick scalps for $50 each. But on that tenth trade, they let a losing position run, hoping it will turn around. That single emotional decision ends up costing them $500.
Let’s break down the math:
- Total Profit from Wins: 9 wins x $50 = $450
- Total Loss: 1 loss x -$500 = -$500
- Net Result: -$50
Despite being “right” nine out of ten times, this trader is actually losing money. Their one undisciplined loss wiped out all their hard work and then some. This is a painful but common reality for anyone who prioritizes winning over managing risk.
Trader B: The Profitable Loser
Now, let’s look at Trader B. Their stats don’t look nearly as impressive, with a win rate of only 40%. Out of ten trades, they only have four winners. The key difference? They are incredibly disciplined. They cut their losses quickly at $100 per trade but let their winners run, averaging $400 per successful trade.
Here’s how their P&L looks:
- Total Profit from Wins: 4 wins x $400 = $1,600
- Total Loss: 6 losses x -$100 = -$600
- Net Result: +$1,000
This is a game-changing insight: Trader B is far more profitable even though they “fail” more often. Their success isn’t from a magic indicator; it’s from psychological strength—the discipline to take small, manageable losses and the patience to let good trades play out.
This contrast reveals the core truth of sustainable trading. While you absolutely need to know how to calculate your win rate, that number is only meaningful when you pair it with your average win and average loss. Only then can you see if your strategy truly has a profitable edge.
Finding Your Edge by Segmenting Win Rate Data
Your overall win rate is just the headline; the real story is always hidden in the details.
A flat 55% win rate might feel average, but it could be masking an incredible 80% success rate on Tuesday mornings and a dismal 20% on Friday afternoons. This is where you move from simply knowing your score to truly understanding your performance.
https://www.youtube.com/embed/HWhTbBFUO3Y
Segmenting your data turns your win rate from a simple metric into a powerful diagnostic tool. Instead of looking at one big number, you dissect it to find where your true edge lies. This means calculating your win rate across different variables to uncover those hidden patterns of strength and weakness.
Uncovering Your Niche
For many traders, the real “aha!” moment comes when they start filtering their performance. It’s about looking beyond the aggregate and asking more specific, pointed questions.
You can segment your win rate by countless variables. Some of the most common ones include:
- Specific Assets: Are you more successful trading stocks like AAPL versus commodities like Gold?
- Time of Day: Do you perform better during the chaotic market open, the midday lull, or the final hour of trading?
- Market Conditions: Is your win rate higher in a clear, trending bull market or a choppy, sideways one?
- Setup Type: Does your breakout strategy consistently outperform your reversal strategy?
Imagine a trader discovers their overall 52% win rate is completely misleading. When they filter for trades taken between 9:30 and 11:00 AM on tech stocks, their win rate jumps to a stellar 78%. But on the flip side, their win rate on afternoon energy trades is a costly 31%. This kind of insight is invaluable; it shows them exactly where to focus their capital and where to step back.
This concept isn’t just for trading. Think about calculating win rate in sales—a team might have a 35% win rate based on the number of deals closed. But when they look at the dollar-value win rate, it might only be 20%, revealing they’re losing the bigger, more important contracts. As these business insights show, lumping all your results together often hides the most critical information.
By dissecting your data, you stop being a generalist and start becoming a specialist. You identify the precise conditions where you have a statistical edge, so you can confidently double down on what works while fixing or cutting what doesn’t.
This isn’t about chasing a “perfect” strategy that never loses. It’s about finding the specific niches where you have the highest probability of success. This disciplined, data-driven approach is how you systematically refine your trading and build a lasting career.
Using Trading Journals to Automate Your Analysis
Calculating your win rate in a spreadsheet is a fantastic start, but let’s be honest—it can quickly become a real chore. The more trades you take, the higher the chance of a simple data entry mistake that throws off your entire analysis.
This is exactly where a modern trading journal becomes a game-changer.

Tools like TradeReview automate the entire process, shifting your focus from tedious data entry to high-level strategic improvement. Once your trades are imported or synced from your broker, the software instantly crunches your win rate alongside dozens of other critical metrics.
From Manual Labor to Instant Insight
Instead of spending hours wrestling with formulas, you can get answers in seconds. This speed allows you to ask much deeper questions and spot patterns you would have almost certainly missed otherwise.
With just a few clicks, you can:
- Visualize Your Performance: See your win rate trend over time with clear equity curves and charts.
- Compare Strategies: Instantly see if your “Breakout Strategy” actually has a higher win rate than your “Reversal Strategy.”
- Filter with Precision: Find your win rate exclusively for trades on Tuesdays, on a specific stock, or only during the morning session.
This isn’t about finding a shortcut to profits; it’s about using technology to enforce discipline. An automated journal ensures every trade is logged accurately, giving you a rock-solid foundation for your analysis. For a deeper look, check out our guide on why every trader needs a trading journal to see how this simple tool can refine your edge.
By automating the tedious calculations, you free up mental energy to focus on what truly matters: interpreting the data, identifying your weaknesses, and doubling down on what makes you a successful trader.
Building a Long-Term View of Your Performance
Calculating your win rate over a single week, or even a month, doesn’t really tell you much. It’s just statistical noise. It’s way too easy to get cocky after a hot streak or feel defeated after a string of bad luck. Real pros think bigger—they build their careers on data spanning months, quarters, and even years.
Your win rate only becomes a reliable compass once you’ve logged enough trades. Without a large enough sample size, any conclusion you draw is just a guess. So, the big question is, how many trades are “enough” to start trusting the data?
Achieving Statistical Significance
There’s no single magic number, but a good rule of thumb many traders follow is to get at least 50-100 trades under your belt for a specific strategy before you make any major calls on its effectiveness. This isn’t just a trading thing; other performance-based fields do the same. For instance, some sales analytics platforms like AtriumHQ recommend tracking at least 10 closed deals per rep before their individual win rates are considered meaningful.
Adopting this long-term perspective lets the law of averages start working for you. Your hard data becomes a powerful tool that keeps you grounded during losing streaks and humble when you’re on a roll.
This disciplined, data-driven mindset is what separates a hobbyist from a professional. It helps you trust your process instead of your feelings, and it’s a critical part of the risk management techniques that will protect your capital over the long haul.
Common Questions About Trading Win Rate
Let’s tackle some of the most common questions traders have when it comes to figuring out and actually using their win rate.
What Is a Good Win Rate in Trading?
This is the classic question, and the honest answer is: it depends. There’s no magic number that works for everyone.
A scalper might need a 70% win rate to be profitable since their gains are tiny. On the other hand, a long-term trend follower could be wildly successful with a win rate as low as 30%, because their winning trades are massive compared to their small losses.
The key isn’t the win rate itself, but how it works with your risk-to-reward ratio. Your real focus should be on finding a profitable balance between the two, not just chasing a high number.
How Many Trades Do I Need for a Reliable Win Rate?
Sure, you can calculate your win rate after five trades, but that number is practically useless. It’s just noise.
To get a statistically significant result—one you can actually trust to make decisions—most traders aim for a sample size of at least 50-100 trades for a specific strategy. A bigger dataset like this helps smooth out the randomness and gives you a much clearer picture of whether your strategy has a real, long-term edge.
The goal is to build a dataset large enough to draw strong conclusions, helping you trust your process over short-term emotional swings.
Should I Include Break-Even Trades in the Calculation?
The short answer is no. Standard practice is to exclude break-even trades from your win rate calculation entirely.
This means you divide your number of winning trades only by the total of your winning and losing trades. This approach gives you a much cleaner view of your strategy’s ability to either make a profit or take a loss, which is what really counts at the end of the day.
Stop guessing and start analyzing. TradeReview automatically calculates your win rate, segments your performance, and gives you the data-driven insights needed to refine your edge. Get started for free today.

